Blog
June 3, 2020

Today, developers are increasingly asked to do more with less time. Luckily, the tools that support PHP development, like IDEs, offer increased coding efficiency, and streamlined debugging processes. In this article, we'll look at the role that IDEs play in debugging, and how PHPStorm and Zend Server can combine for a streamlined PHP debugging experience.
Back to topMigrate Zend Server to ZendPHP
Zend Server reaches end of life on December 31, 2027. Luckily, migration has never been easier through the ZendPHP Ansible playbook. Click the links below to learn more.
Development, Debugging, and IDEs
Of all the fields in Information Technology, software development can be one of the most creating and rewarding. Watching and participating in the creation of a new function or solution and raising it from the infancy of a new idea to the maturity of a fully functional solution can be truly breathtaking. It can also be one of the most frustrating endeavors you will ever undertake.
Any of us who have written code beyond the simplicity of a "hello world" program knows the agonizing frustration of looking for that elusive syntax error or worst yet logic defect. We've all uttered the phrases – "well that's odd", "it should work", and even the occasional "it's not my fault" when developing and debugging code.
Many developers rely on manual methods to debug their applications including placing echo statements around and through the offending code and using functions such as print_r() and var_dump() to get a look at values of variables at different execution points. And editors? It's breathtaking how many developers still rely on editors such as notepad for development of their code. For all of this there is a better way!
The use of Integrated Development Environments (IDEs) can greatly enhance and left-shift the development process.
Back to topLeft-shift is a term that has been given to the process of moving defect isolation to the left of the overall Software Development Life Cycle (SDLC) such that defects are found during development rather than follow-on Quality Assurance (QA) and testing processes of the SDLC. Left-shifting defect isolation and resolution can dramatically decrease the overall SDLC time-cycle which has a subsequent reduction in the cost of software development and also results in quicker time-to-market with new products, features, and functions.
Zend Server and PHP IDEs
When it comes to PHP there are a number of IDEs that can be used in the development process including Zend Studio, Visual Studio Code, Eclipse, and many others. IDEs tend to share a common set of functions including code-completion, code-hints, and step-wise debugging. When working in the Zend Server environment it's important to have an IDE that can integrate with the functionality that Zend Server provides and that is where the topic of this blog comes into play. While many IDEs have integration capabilities with Zend Server, this blog will concentrate on PHPStorm, the popular PHP IDE from JetBrains.
The capabilities that Zend Server provides for assisting with the development process are fairly robust and they become even more beneficial when Zend Server is integrated with an IDE. As an example, the Dashboard and Monitoring pages of Zend Server show events that have been detected by the Application Server. From the events a number of IDE actions are provided including Debug, Profile, and Export. These types debug-related functions are available from the code-trace function of Zend Server as well.
Zend Server With PHPStorm
The remainder of this blog will take a look at a typical development scenario and how PHPStorm can be used with Zend Server. Specifically we will look at an existing project in which the source files reside on the web server.
Let's get started.
Back to topGoal 1: Create a PHPStorm Project
Since we are bringing an existing development effort into PHPStorm we want to create the project in PHPStorm from existing files. This can be accomplished by selecting the File → Create New Project from Existing Files option. A dialog box is displayed for selecting the environment for the location of the Web Server as well as access to the code files:
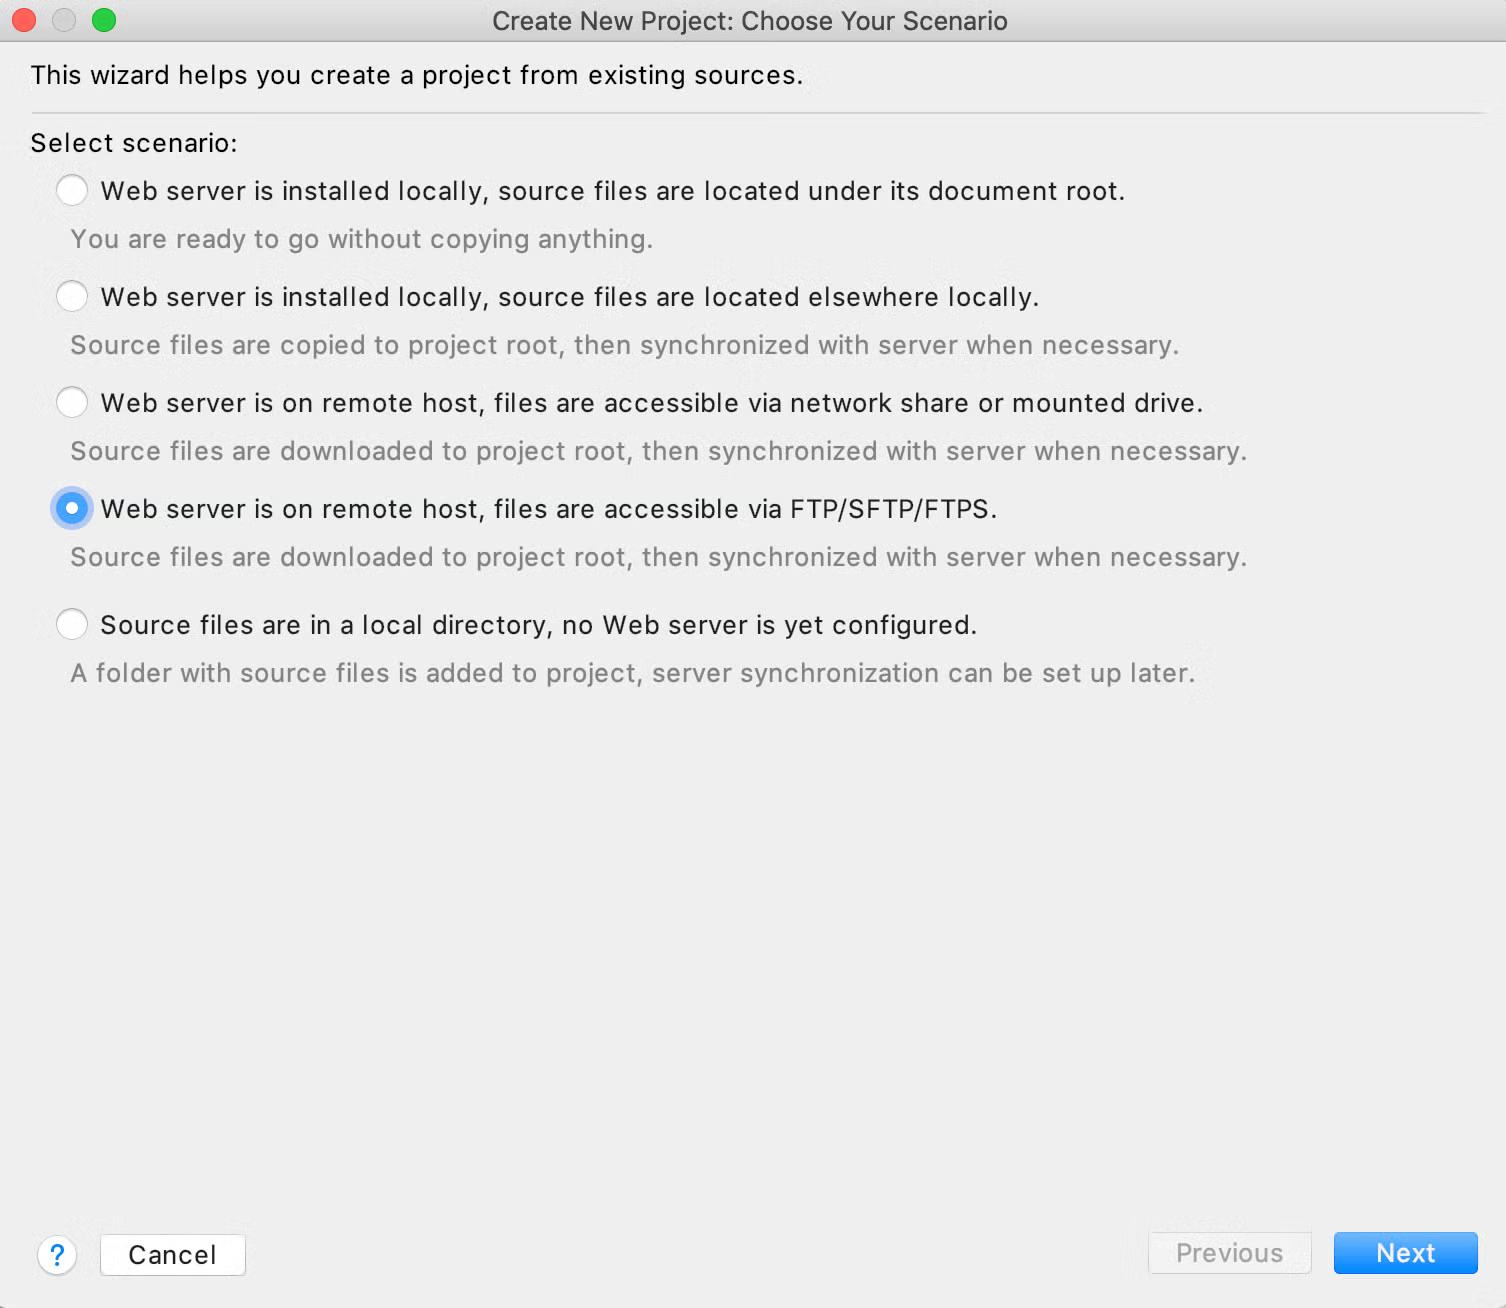
In this example the Web Server as well as the application files are located on a remote host. Since the application files will be accessed via Secure FTP the appropriate selection is as shown above.
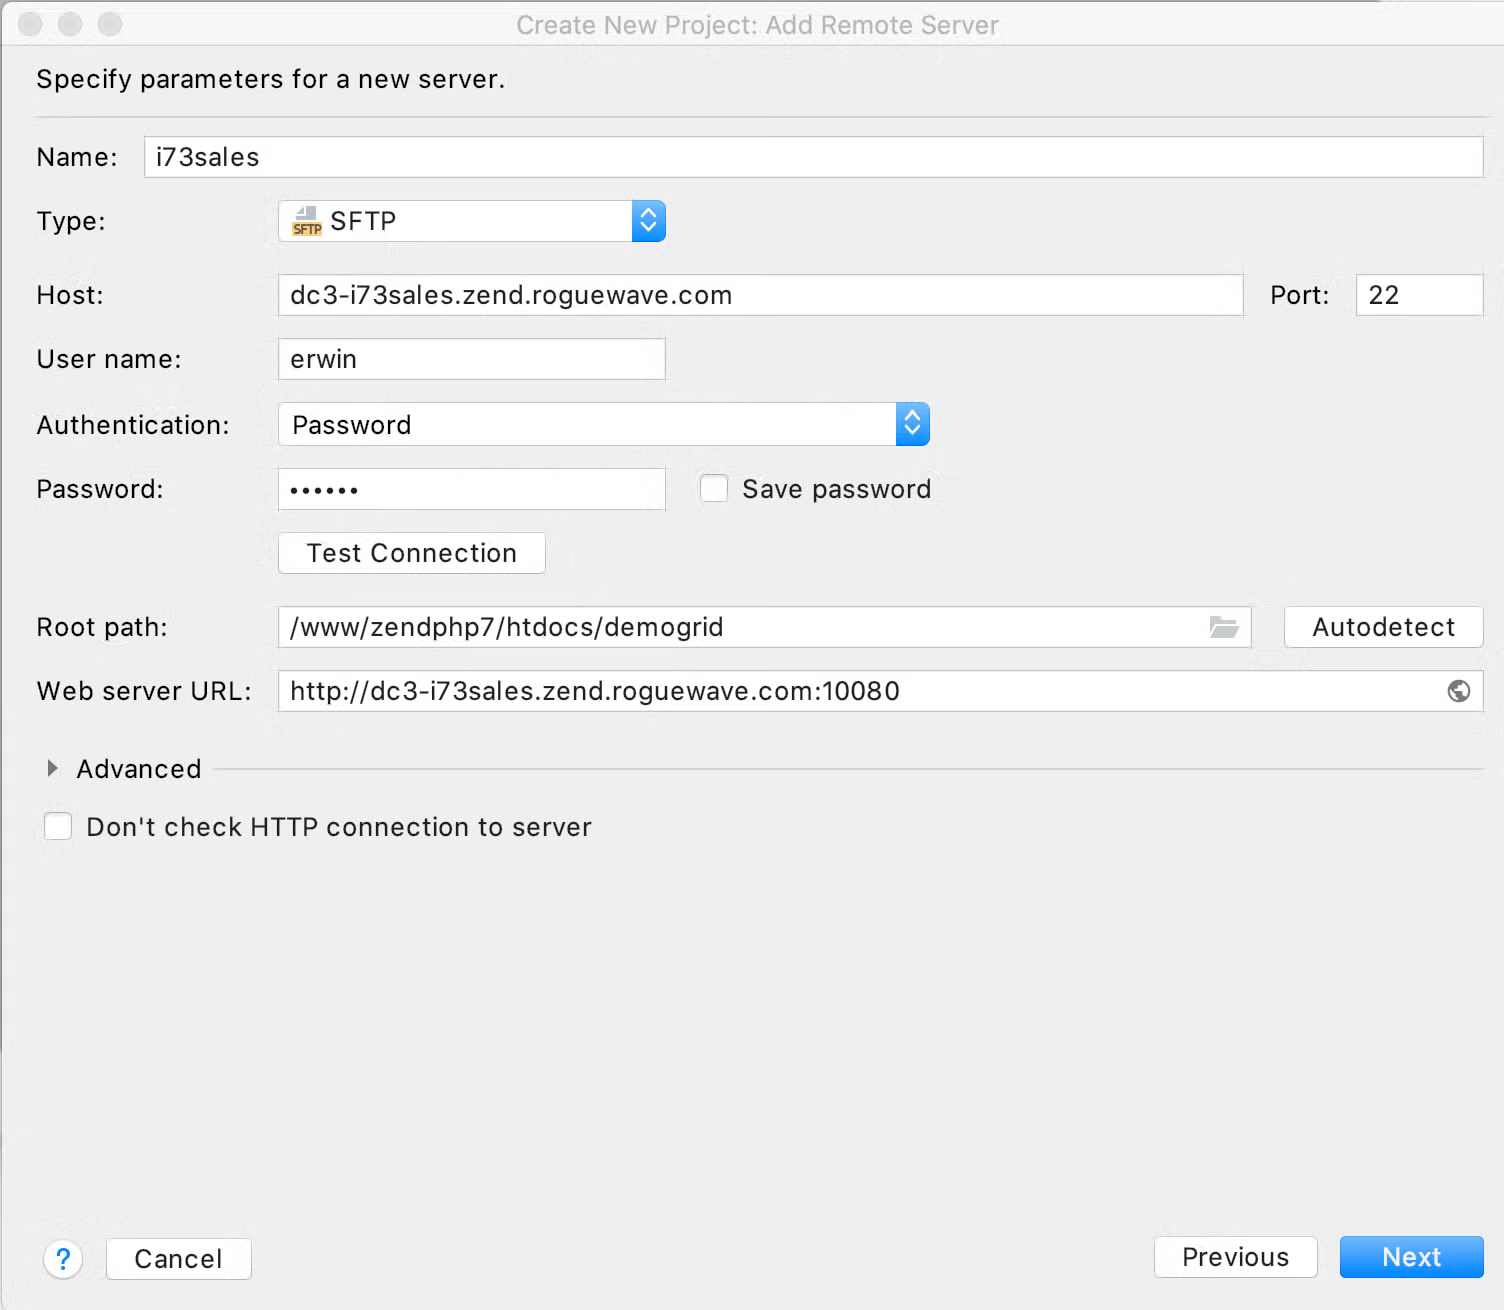
The next step in project creation is to provide a name for the project. It should be noted that the project name will be appended to the default project local path which can be modified. The final step in the project configuration is to provide the connection information to the remote server where the code is located:
Now that the project has been defined the application files will be copied into the local project. Depending on the size of the application files this step may take several minutes.
Goal 1 has now been completed – the application files reside in a local project that is synced with the server. The editor provided by the IDE can be used to work on the local copy of the application files taking full advantage of features such as code completion, folding, and assistance.
Back to topGoal 2: Create a Debug Session From ZRay
The remaining goals need to have debug integration between Zend Server and PHPStorm configured. The first part of the configuration is on the Zend Server side. You will want to ensure that the Zend Debugger component is enabled under Administration→Components. Additionally there are specific configuration settings that need to be made on the Debugging→Debugger page:
- Set the Debugger to Zend Debugger
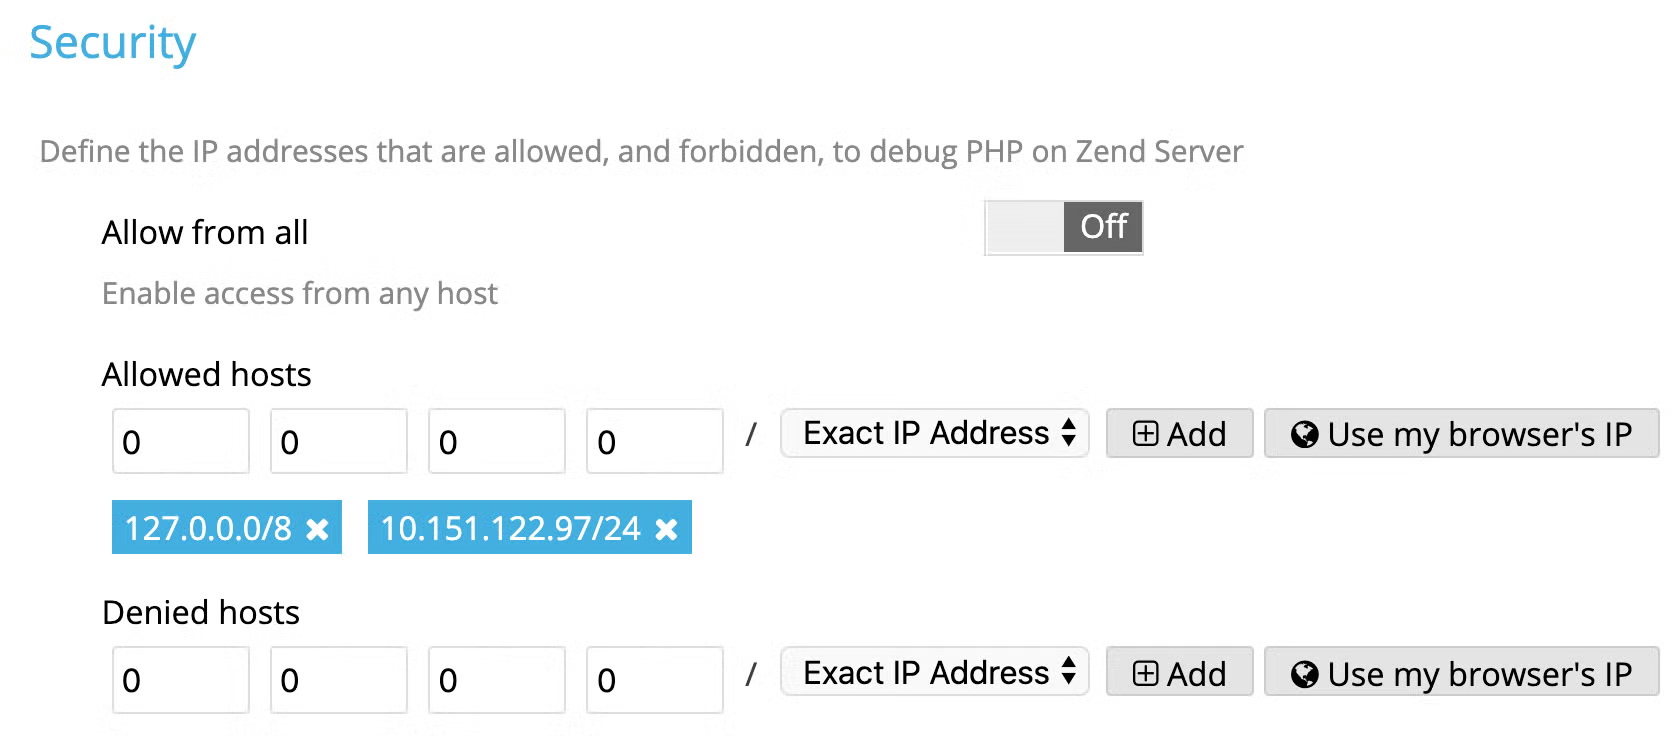
- Set the Security settings to match your environment. Specifically, determine if connections to the debugger are going to be limited to a certain set of clients and if so configure appropriately:
- Configure the IDE Client settings to either autodetect (recommended) or provide a specific hostname/ip-address and port number (default port is 10137)
- Configure the IDE Integration Settings to indicate if debugging execution should stop at the first line of code on the page and if debugging can use pages stored on the file system if they are available rather than the files located on the web server
On the PHPStorm side:
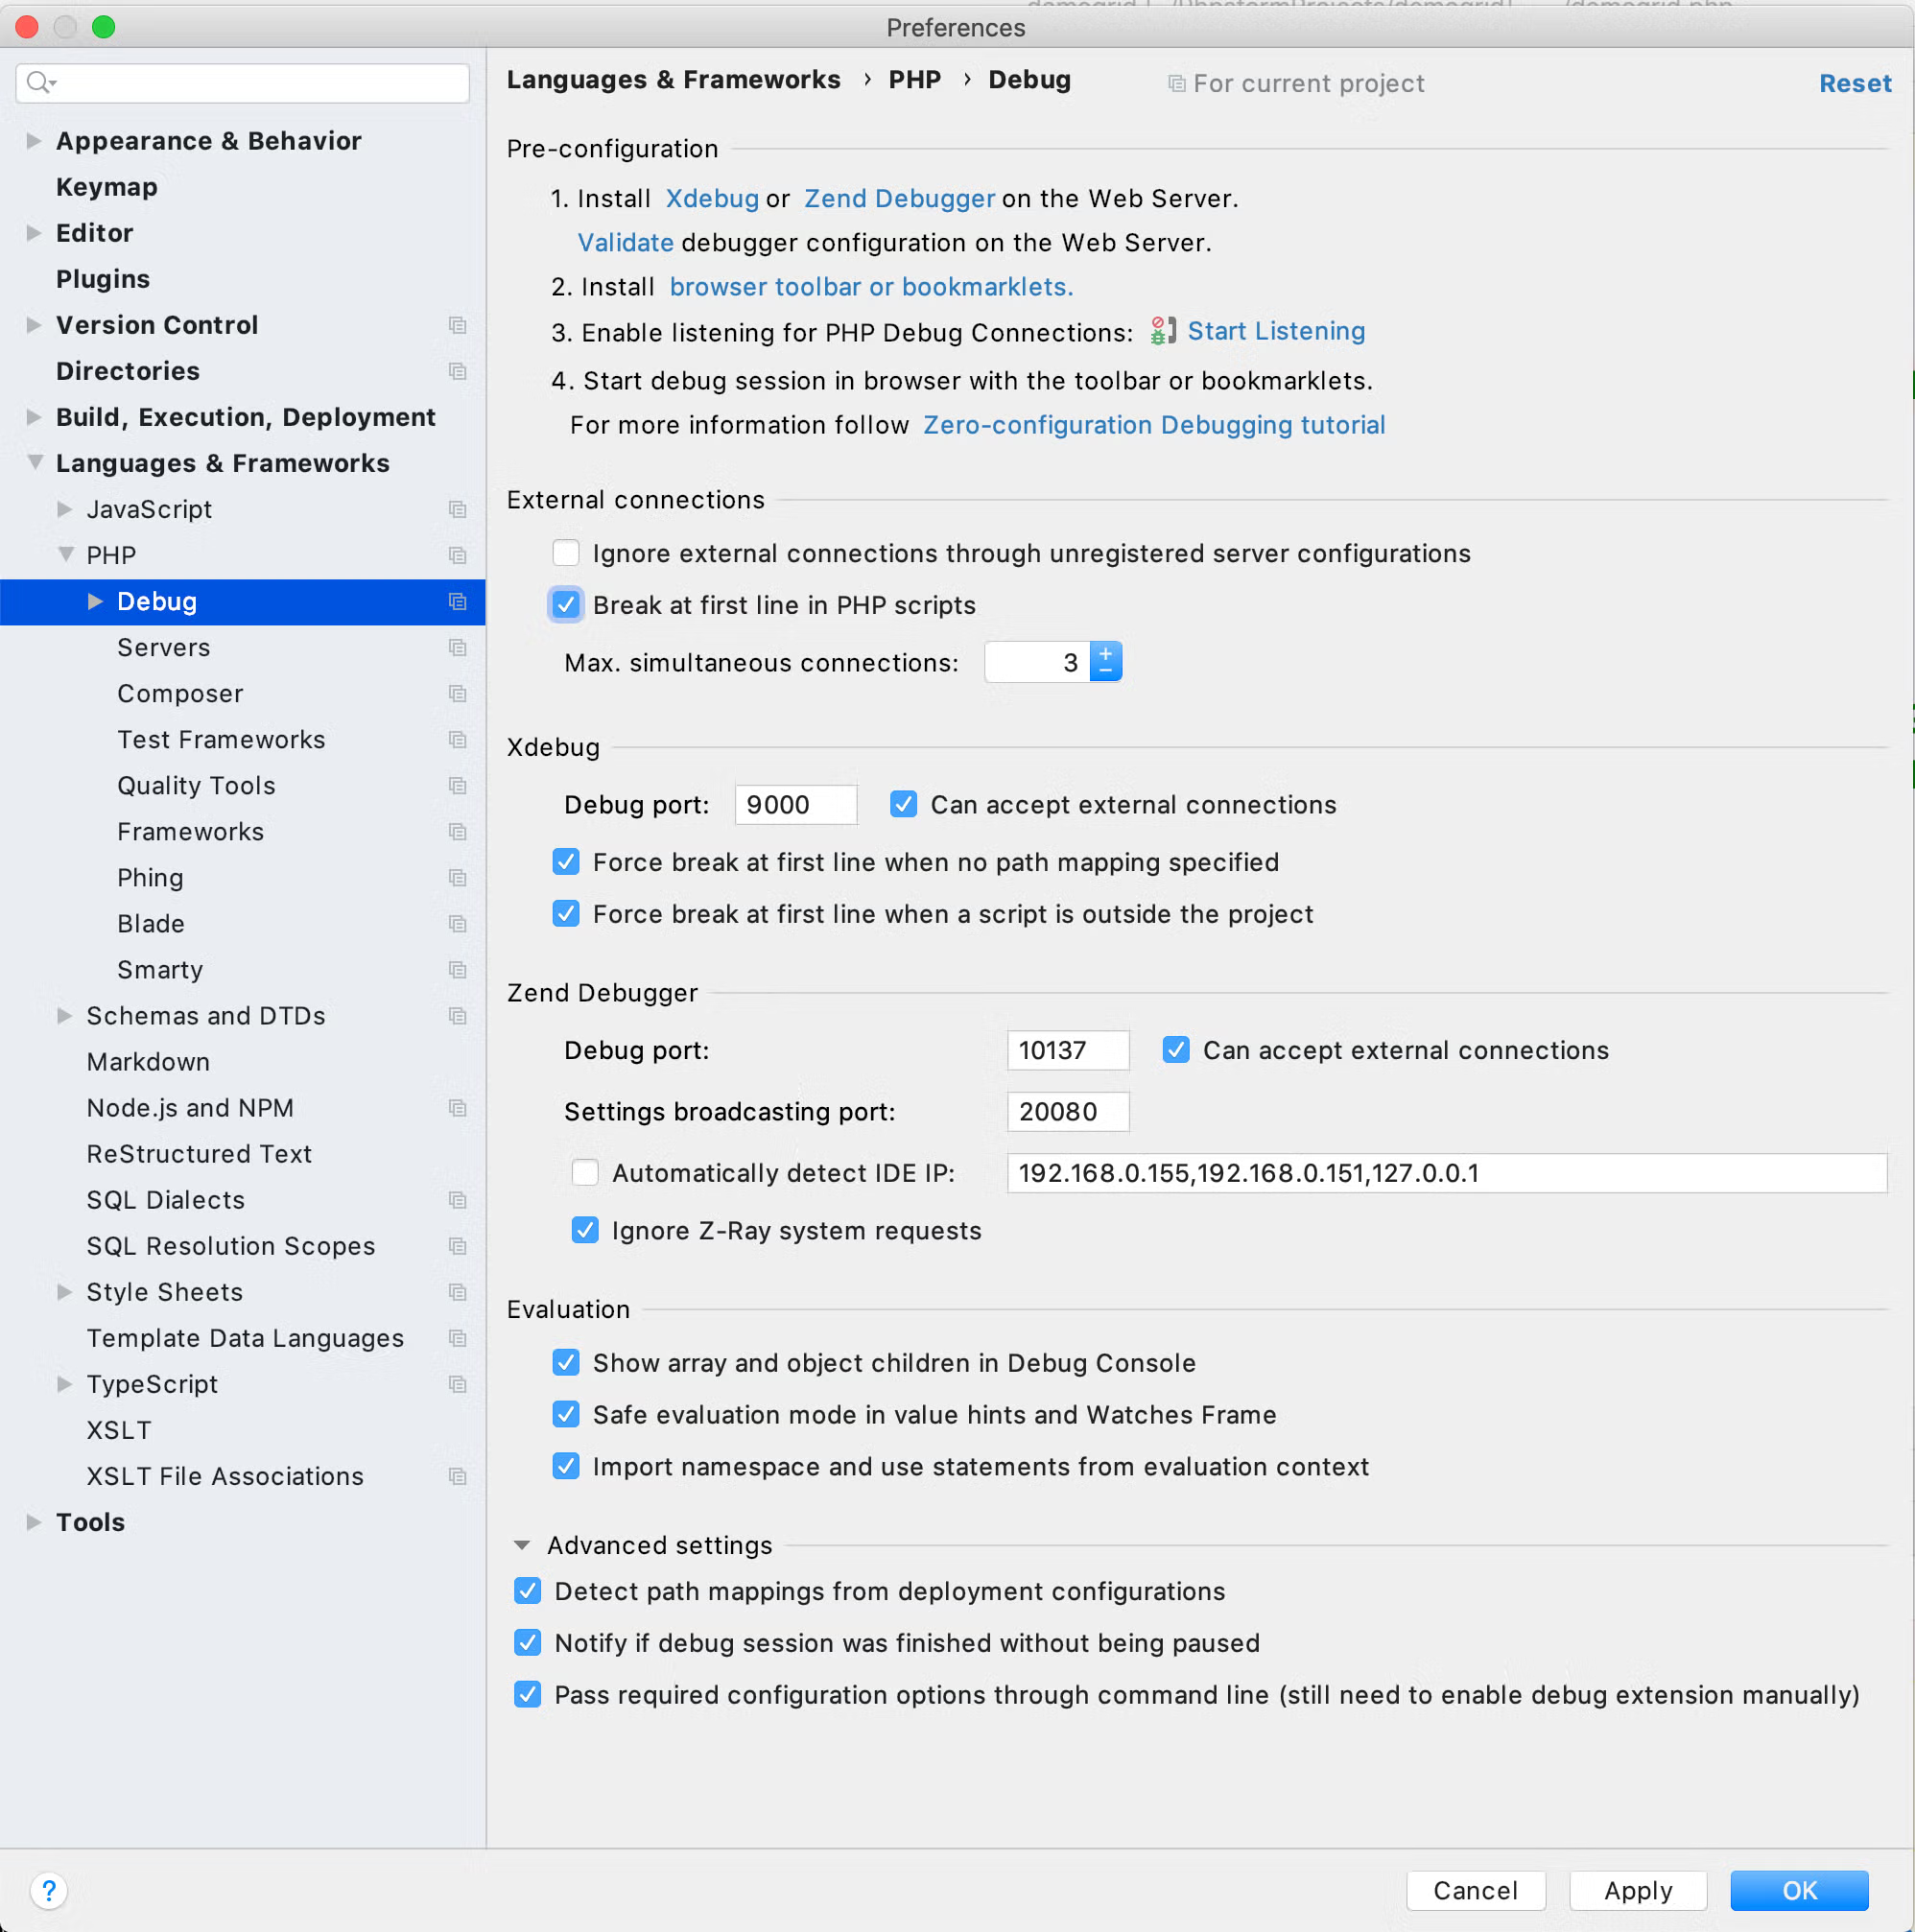
From PHPStorm→Preferences→Languages & Frameworks→PHP→Debug
- Ensure that the Zend Server Debug port is the same as specified in Zend Server's debug configuration (likely 10137)
- Unselect the 'Automatically detect IDE IP'
One other configuration step that needs to be taken is to configure a debug/deployment connection. This step is similar to the remote connection configuration step from the project creation shown earlier. Configuration of debug/deployment connection is accomplished by selecting Tools→Deployment→Configuration from PHPStorm:
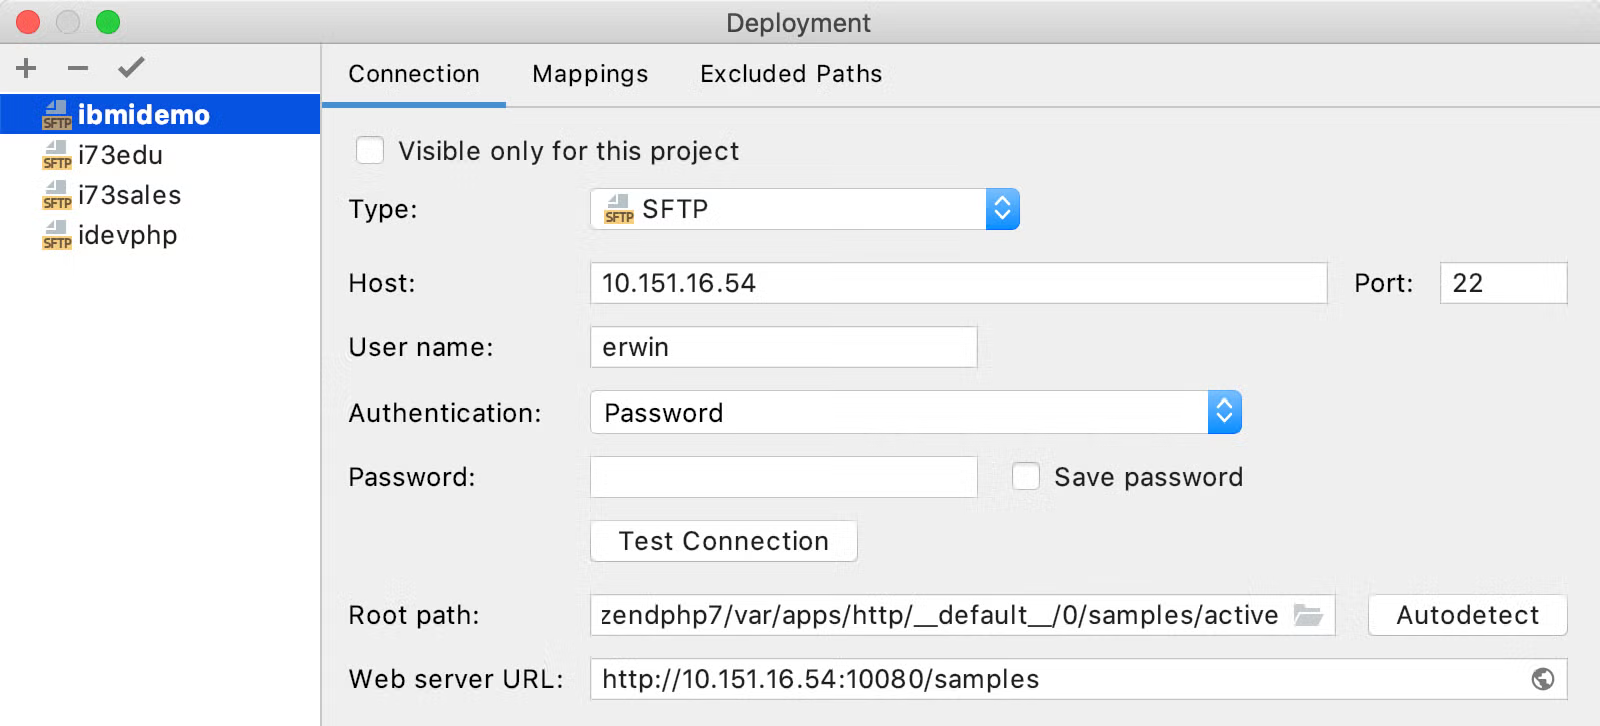
Complete this form as follows:
- Select the desired connection type. For this example, secure FTP is being used
- Provide the hostname or ip address for the server that the debug request will be sent to
- Provide credential information for the connection (user name, password)
- Provide the root path for the application that will be debugged
- Provide the URL for the application to be debugged
Also, check the mappings tab to ensure that the Deployment path and Web path are set appropriately. Typically they are set at root (/). Note that the deployment path is relative to the server root path and the web path is relative to the web server URL.
Now that the integration between PHPStorm and Zend Server has been configured the connection can be established. One way to establish the connectionis via an SSH tunnel. The SSH tunnel essentially establishes that the debug requests will be seen on a given port (in this case 10137) on the system that PHPStorm is running on which is localhost. The other end of the tunnel is the system that Zend Server is running on (in this example dc3-i73sales.zend.roguewave.com)
ssh -R 10137:localhost:10137 erwin@dc3-i73sales.zend.rougewave.com
Now that debug integration has been configured and the connection established debug sessions can be initiated. Let's first take a look at how to initiate a debug session from ZRay. This assumes that ZRay has been enabled in Zend Server.
- Ensure that PHPStorm is listening for PHP Debug Connections. This is accomplished via the debug connections icon (represented by a small green bug and phone icon). Hovering over the icon will indicate if PHPStorm is listening for debug connections. If it is not listening, click on the icon.
- Go the web page that you wish to debug.
- On the ZRay toolbar, click on the debug icon (shown as a blue bug).
- Select Debug current page from the displayed list of functions
At this point the code should be displayed in the PHPStorm window with a breakpoint at the first line of code. Now, PHPStorm can be used to step through the code, inspecting various variables along the way. As an example:
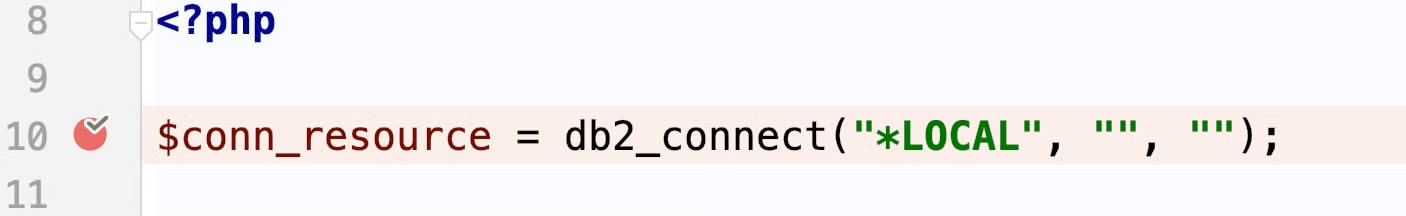
This shows that execution is currently stopped at the db2_connect() statement.
Selecting the step icon will cause the line to be executed.
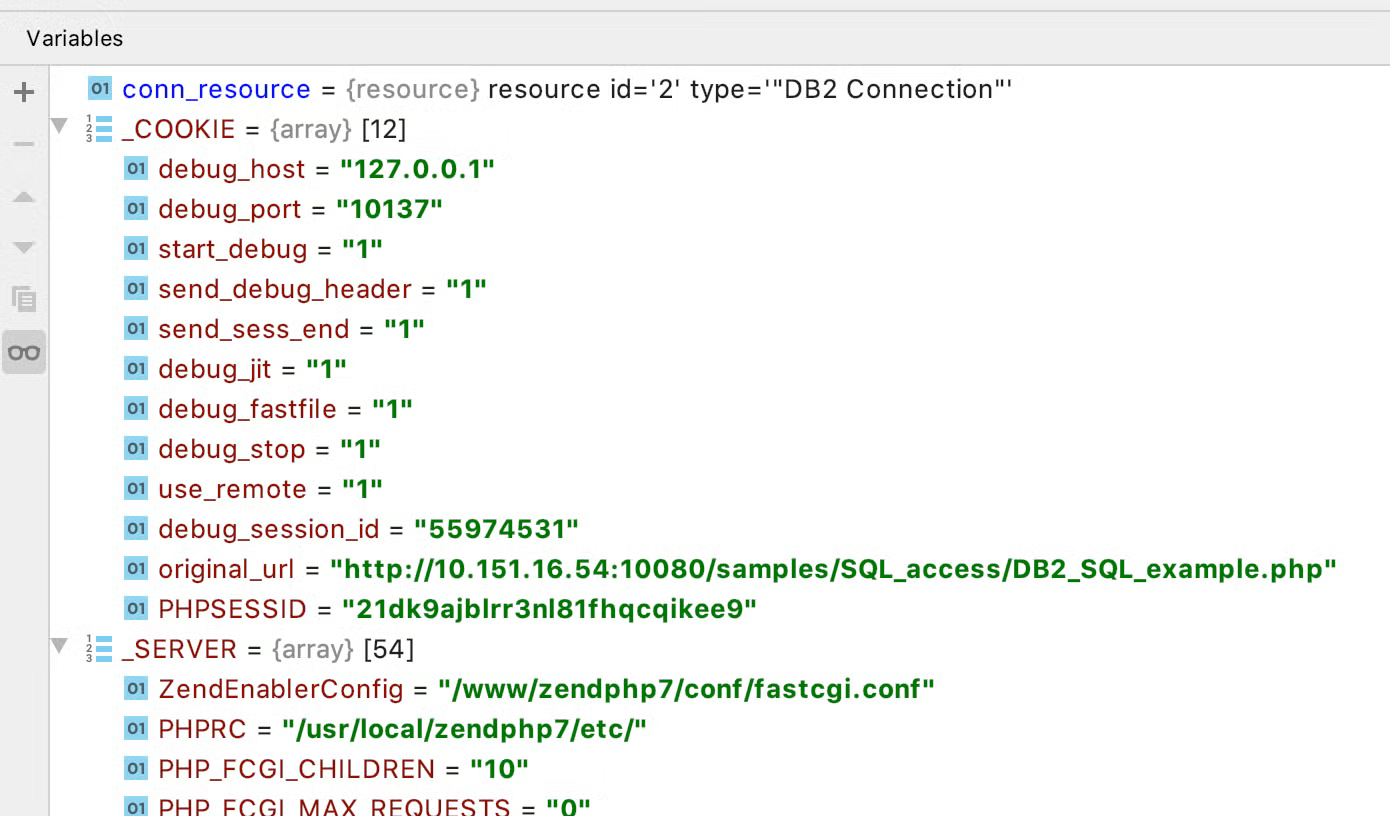
After the line has been executed, if the cursor is hovered over the $conn_resource variable an indication of the variable contents will be displayed:

In PHPStorm, the 'Debugger' pane can be used to inspect various variables such as the _COOKIE and _SERVER arrays:
A debug session can be terminated by selecting the stop icon (represented by a red square).
Back to topGoal 3: Create a Debug Session From Web Page
The final item this blog will take a look at is establishing a debug session from a web page. In order to initiate a debug session the Zend Debugger Toolbar will need to be added to the browser.
Once the extension has been added to the browser a new icon (shown as a small blue window with a green bug) will be displayed at the top of the browser window. At this point you can browse to the page to be debugged, select the debug icon followed by Debug current page from the menu and the debug information will be displayed in PHPStorm at which point the interface can be used to step through the code, and inspect variables. Additional functions such as setting watches on variable modifications can are also available through the interface.
Back to topFinal Thoughts
This blog provided an overview of the usefulness of IDEs and covered some basics of PHPStorm integration with Zend Server including creating application projects, integrating PHPStorm with Zend Server for debugging, and initiating debug sessions from ZRay and Web page. Future blogs will look at additional functionality provided by the integration of these two powerful tools including launching the IDE from Zend Servers code trace and event information.