Blog
December 15, 2022
PHP tracing (ie, code tracing in PHP applications) is important for teams who need to identify and resolve issues in production. It is an incredibly useful tool for troubleshooting errors, improving application performance, and identifying issues before they can become problems. While it used to only be accomplished manually, code tracing is now achieved as a feature of software monitoring.
In this blog, I give an overview of code tracing and explain why code tracing is important for PHP applications. I then walk through how to use ZendPHP and ZendHQ to simplify code tracing within your application.
PHP Code Tracing: Overview
What Does Code Tracing Mean?
Code tracing refers to a feature of software monitoring where the program produces a log of information regarding the program's execution. This log is typically in the form of language directives and function calls. Software developers can then use this information to perform root cause analysis of software errors.
Learn More About PHP Log Analysis
Why Is Code Tracing Important?
Code tracing is important because it gives you valuable insight into critical web applications. It matters because you may or may not know who experienced the error or how they encountered it. Using code tracing, you can resolve the issue and prevent it from reoccurring.
When Is Code Tracing Used?
Code tracing is used to complete many tasks, including debugging, performance monitoring, and more.
Back to topPHP Code Tracing and Error Logging in Web Apps
When a PHP error occurs in a production application, a developer often has little to no knowledge of what led to the error. If they have set up copious logging, they may be able to identify some of the application input from the point of the request initialization to the error, but often this information will omit pieces of context that can be useful for diagnosis.
Additionally, while logging in a production application is highly useful for such purposes, it also introduces a lot of application overhead (logging usually involves some form of input/output or network operations, each of which lead to increased execution time and memory), and may be difficult to query in real time. Finally, while logs can help in diagnosing an issue, they generally will not notify you of issues.
Back to topCode Tracing and PHP APM Tools
Application monitoring can assist with this latter aspect. An Application Performance Monitoring (APM) tool allows infrastructure teams to define conditions of interest: long execution times, high memory usage, errors, failure to connect to integrated services, and more. When a rule is matched, the APM tool can log the issue, and, often, push notifications to the infrastructure team (e.g., via chat ops, mobile push notifications, and more).
When an APM tool is able to provide PHP tracing, you get an even more valuable tool: you can tell the APM rule that you want a trace captured, which then gives you the full context for the request that triggered the rule: function calls (including their parameters and return values), language directives called, files and libraries included, and more.
This information makes it far easier to:
- Identify the root cause of a problem
- Create a reproduction case for your test suite (as you have all the conditions that led to the issue)
- Monitor for additional occurrences of the problem in the future
Code Tracing Simplified with ZendPHP and ZendHQ
ZendPHP secure runtimes, combined with the advanced observability and orchestration tooling supplied by the ZendHQ extension, deliver the building blocks for modern, scalable, and secure web applications. Starting with version 1.2.0 of ZendHQ, we now offer Code Tracing as a standard part of our observability tooling, which also includes Monitoring and Z-Ray.
If you already use ZendHQ, you will need to:
- Update the zendhqd package on your ZendHQ nodes.
- Update the zendhq extension package on your ZendPHP nodes.
These are typically done by using your operating system package manager’s “update” or “upgrade” functionality.
If you are not yet using ZendHQ, refer to our documentation for installation instructions.
Guide
See How PHP Code Tracing Works in ZendHQ
ZendPHP + ZendHQ makes code tracing easy. Schedule a custom ZendHQ demo or start a 21-day free trial to learn more.
By default, Code Tracing is enabled in both the ZendHQ extension for ZendPHP and in the ZendHQ daemon. You can toggle it on and off via the following settings:
- For zendhqd, in the zendhqd.ini file: “zendhqd.extension = zendhq_codetracing“ (remove the line to disable it; add the line to enable it). You will need to restart the daemon after making any changes (usually “sudo systemctl restart zendhqd”).
- For the zendhq extension, in the zendhq.ini file: “zendhq.codetracing.enable = 1” (1 is enabled, 0 is disabled). Depending on the PHP SAPI you use, you will either need to restart your php-fpm daemon, or your Apache process.
The ZendHQ GUI will auto-update on launch to pull in the new features supporting Code Tracing.
Code Tracing Configuration
Code Tracing in ZendHQ is tied to the Monitoring feature. When configuring severities for a given monitoring rule, you will now see a checkbox to “Trace code” under the “Actions when triggered” heading.

Discovering Code Traces
When a monitoring rule is matched that captures a trace, you will see each of the following:
In the Event Log, there will be a link to the most recent code trace captured for the event. This will take you directly to it.
- In the Code Tracing “Traces” list, you will see a list of captured code traces. These link to the event that triggered them, but clicking anywhere on the row will open the code trace.

Viewing a Code Trace
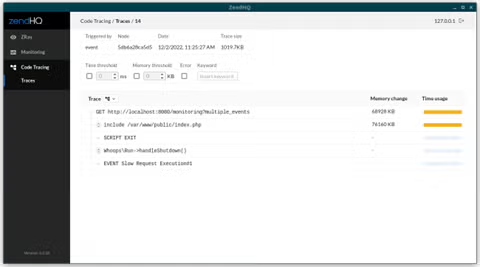
When you click on a code trace, you will get a tree view.

You can use the toggles next to the “Trace” button to fully expand the tree or fully collapse it. Alternately, you can manually expand individual branches of the tree yourself by clicking the toggle to the left of each branch.
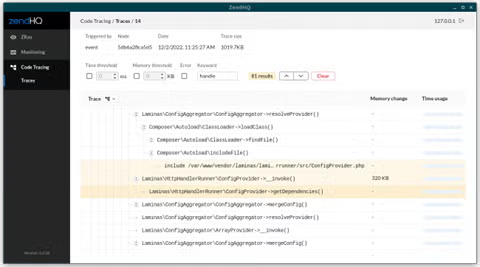
Since trees can be large, you may want to search for items of interest. Code Tracing offers four different ways to search the tree and narrow the results:
- By minimum execution time threshold
- By minimum memory consumption threshold
- By errors and exceptions (toggleable only)
- By keyword; this searches the trace line as presented in the tree
You can combine the searches as well; combining them will return any results that match any of the conditions; in other words, selecting multiple conditions will not narrow to those that only match all of them.
When you have searched, you can use the next/previous buttons next to the count of results to move between matching lines in the tree; doing so will expand the tree when necessary.

Trace Line Details
Clicking on any trace line will open a drawer with details about that line. These details vary based on the line type; for example, the details for an “include” directive will only detail the file included, where the directive was called, and exclusive time and memory usage.
For a function call, you will get far more details. All function calls detail the arguments provided, and the return value or exception thrown; this information can also be copied to your system clipboard. If the function call was related to a static class method or an instance class method, you’ll get details about the class, which instance was used, and more.
Finally, if a particular function was called multiple times in the request, you will get a list of additional invocations. Each of these lines may be clicked on to take you to that invocation in the trace tree, and detail its own specific arguments and return value.
Back to topFinal Thoughts
Code tracing provides an important tool for helping your DevOps or Platform Engineering teams to identify production issues, as well as diagnose them. The information captured during code tracing allows teams to create reproducible tests, which can then be used to both fix the issue, as well as ensure it never happens again.
Additionally, with information such as execution time and memory consumption, you can use a combination of Monitoring and Code Tracing as a way to profile your production code and identify bottlenecks. These will allow you to identify places you may want to provide caching, or optimize database queries or web service calls.
Secure Runtimes Paired With Advanced Observability Tooling
Zend offers fully-supported and secure PHP runtimes with ZendHQ. When paired with ZendHQ, applications unlock easy-to-implement scalability and advanced observability.
Additional Resources
- Blog - Getting Started With Web Application Monitoring
- Blog - Exploring ZendHQ Database Query Introspection
- Blog - Why Good PHP Monitoring Matters
- Blog - Optimizing PHP Web Apps by Integrating ZendPHP With PhpStorm
- On-Demand Webinar - Observability and Orchestration With ZendHQ
- Guide - How to Develop Web Applications with PHP

