Blog
January 24, 2023

Finding and fixing PHP errors in production, even with rigorous testing and QA processes, is inevitable for teams managing PHP applications. But how are teams finding errors in PHP during production?
In this blog, we look at common ways teams find and check PHP errors — and walk through a few applied examples for fixing performance issues, functional errors, and timeout errors.
Back to topIdentifying PHP Errors During Production
According to our 2023 PHP Landscape Report, 77.7% of surveyed PHP teams use application logs to discover issues in their production applications, while 66.2% use user reports, and 42.5% use application monitoring tools.
In the following sections, we give a brief overview of those options, with considerations teams should make when using each option.
Free Report
How Are Teams Identifying and Resolving Production Issues in 2026?
According to our 2026 PHP Landscape Report, 80% of PHP teams use log analysis. Our experts unpack what this means for your team while exploring emerging trends.
Finding PHP Errors With Application Logs
The most common way of tracking down PHP errors is to simply use the logs of your application. Log files should be checked regularly to verify the health of your application. These can be the default logs consisting of warnings and errors, but you can also log your own information to log files or even your own custom log file to keep things organized.
Log files can be very informative, but they can also be limiting, in that the information may not be as verbose as you need at the time. Logs are typically one line of concise information, and sometimes they can even be vague or point to a line of code that didn’t really cause the error, but that’s where everything failed.
Leveraging User Reports to Identify Errors in PHP
It's always better to proactively catch PHP errors in your applications, rather than have them found by our users, but it happens. User reports can be very helpful for identifying errors in PHP, especially when they’re detailed and include screenshots.
Application Performance Monitoring Tools for Identifying PHP Errors
There are many performance monitoring tools available today. ZendHQ, New Relic, Datadog, and Sentry are just a few of them. These tools connect with your application to gather logs, timings, stack traces, and much more data to coalesce it all into reports with graphs. This is tremendously helpful in PHP application monitoring, triaging PHP errors, and general performance.
Try ZendPHP + ZendHQ Free for 21 Days
Ready to discover what ZendHQ and ZendPHP secure runtimes can do for your infrastructure? Try both free for 21 days — no commitment required.
How to Fix PHP Errors During Production
It is always our hope that by the time our PHP application source code has reached production, we’ve caught and patched all PHP errors in QA/testing environments.
However, this isn’t always the case, and that’s why having PHP application monitoring tools in place for production is important. Having tools like ZendHQ in place helps us to proactively find errors in PHP and have them patched before users become aware of them. Below, we’ll cover a couple of common php error examples.
Back to topAddressing Functional Errors
Among the simplest and most common of PHP errors are functional errors. These are errors in PHP where the source code was written in a way that cannot run. Whether that’s incorrect number of function parameters, variable type mismatches, or even improper syntax; they break the user experience and cause code 500 errors.
While these PHP errors are simple, and hopefully found during development, sometimes you will be dealing with dynamic user input — which can make it difficult to catch all cases. For example, we could be relying on the user to input the name of a PDF file to open and display, and upon entering the incorrect filename, PHP fails to open the stream because no such file exists.
Finding Functional PHP Errors
Using default production configuration of PHP, functional errors will be logged to the configured error log location. This is why we should be regularly checking these logs, especially during development and deployment, to ensure we catch simple issues like these. In the above “no such file exists” example, these typically log as a warning within log files with the file and line number where the error occurred.
With thorough testing, functional errors are generally easy to catch.
Fixing Functional Errors
Once the log of the issue is found, look for the filename and line number. In the “no such file exists” example, we can track down the file and line number causing the error, which is probably a statement calling the `fopen()` PHP function. If we’re using dynamic input from the user for the filename, we’ll want to first check if the file exists, and if not, give a friendly message to the user that the file they’re requesting doesn’t exist.
It's also important to note here that while the file and line number do indicate where the PHP error happened, it doesn't necessarily give you the full context of why the error occurred.
Back to topPerformance Issues and Timeout Errors
Performance issues and timeout errors are much trickier than functional errors. These are the issues that can easily go unnoticed until end users give feedback. Slow requests, functions, database calls, and other slow executions may not appear during development, but still have a huge impact on the user experience under the stress and load of real-world traffic.
Monitoring tools can certainly help with functional errors, but they shine when it comes to performance issues. With monitoring tools like ZendHQ, you can configure rules to monitor and alert you and your team about all types of errors and performance issues, saving a lot of headaches when it comes to keeping track of application performance.
Finding Performance Issues and Timeout Errors
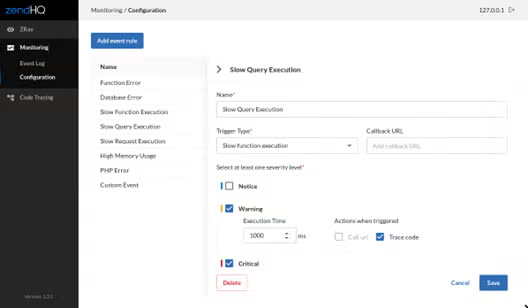
Monitoring tools make it relatively easy to keep track of performance issues. ZendHQ’s monitoring tools allow you to setup rules of differing severities (e.g., notice, warning, and critical; all with configurable thresholds) for not only functional errors, but also slow executions and abnormal memory usages.
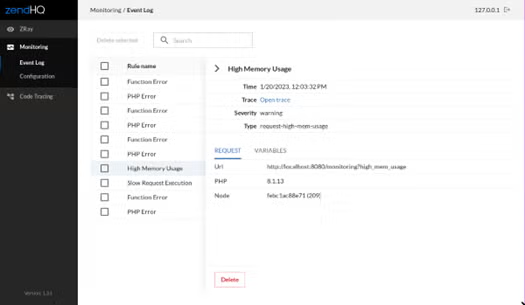
Additionally, you can monitor custom events, which you can trigger directly from your application. You can even configure a callback URL, which can be used to send a Slack notification to your team when a database query execution takes much longer than it should, for example. Once notified, you can then use ZendHQ to find what triggered the event. Code tracing can be enabled for each threshold, making it even easier to track down the root cause of the performance issue.
In summary, ZendHQ is able to provide the context of the error that is typically missing from standard log files. With context provided, teams can save considerable time in debugging, and ultimately be more precise in their efforts.
Fixing Performance Issues & Timeout Errors
There’s a myriad of PHP errors that could affect the performance of your application. Therefore, there’s no good one-size-fits-all solution for these types of issues. However, monitoring tools like ZendHQ make it a lot easier to proactively find these issues and track down the root cause. With the rules in place, the detailed code tracing can be used to find unnecessarily duplicated function calls, slow executions, and even slow database queries. From there, it’s simple to triage and tune the performance. Without monitoring tools, it’s a lot to keep up with!
Back to topFinal Thoughts
There are a variety of ways teams can find PHP errors in their production applications. Whether that's through application logs, user reports, or PHP application monitoring tools like ZendHQ — working to consistently address and resolve these issues before they become a problem is critical to maintaining the success of your applications.
Keep an eye out on this blog for more tips and tricks around resolving issues in your PHP applications.
ZendHQ Makes It Easy to Find and Fix PHP Errors
ZendHQ makes it easy for teams to identify and resolve issues in production PHP applications. See more details by visiting our ZendHQ solution page today.
Additional Resources
- Blog - PHP Debugging: Go Beyond Step Debuggers With ZendHQ
- Blog - Exploring ZendHQ Role-Based Authentication Features
- Blog - Exploring ZendHQ Database Query Introspection
- Blog - Why Good PHP Monitoring Matters
- Blog - Introducing JobQueue for ZendPHP
- Blog - Debugging PHP Segmentation Faults
- Blog - PHP Code Tracing With ZendHQ
- Blog - Optimizing PHP Web Apps by Integrating ZendPHP With PhpStorm
- On-Demand Webinar - Observability and Orchestration With ZendHQ