Blog
November 6, 2025
Using PHP Web Application Performance Metrics for Early Threat Detection

Security,
Performance
Web application performance metrics provide valuable insights into the health of your PHP systems, including acting as early warning signals for security threats. For instance, apps slowing unexpectedly, queue times spiking, or database calls surging can all be symptoms that could point to brute-force attempts, data exfiltration, or other malicious behavior. By catching issues early, you can avoid expensive and damaging consequences for your organization.
In this blog, I walk through how to use PHP performance metrics to improve enterprise application security, beginning with the importance of a security-first approach at all stages of development. Next, I explain how to use telemetry data (including metrics, logs, and traces) as a part of your security strategy, ending with a few recommended solutions and support options.
Back to topBuilding a Security-First Foundation for Enterprise PHP Applications
Before I get into how to use PHP application performance metrics, logs, and traces for early threat detection, I need to cover the basics of PHP security, and the importance of having a PHP security roadmap. After all, effective PHP security begins long before the first line of code is written. Rather, it starts with foundational decisions about your infrastructure, data protection, and development practices.
PHP Deployment Security Considerations
Your first decision will be where and how you plan to deploy your application, as understanding the environment will reveal a great deal about which future security concerns will be your biggest challenge.
For instance, will your application be on premises, or in the cloud? Will you use virtual machines, or deploy containers? Depending on your choice, you will find yourself facing different security exposures. Additionally, should you opt for a platform as a service — a popular option as it simplifies deployment — you must also determine if you’re satisfied with the platform’s security posture.
Hardening to Meet Compliance Requirements
You must also decide which operating system (OS) you’ll use, or if you’ll use a distro-less container. Regardless of your decision, an OS will exist somewhere in your stack, and you must be able to harden it to meet your PHP compliance needs. After all, meeting standards like PCI DSS, SOX, or HIPAA is never optional, particularly in strictly regulated industries like finance or healthcare.
I recommend starting with the Center for Internet Security (CIS) benchmarks as your foundation for hardening PHP applications. CIS benchmarks can help you comply with a large number of guidelines and regulations, ensuring that certain activities are absolutely prohibited on the system and prevent specific vulnerabilities.
Meet CIS Benchmarks With ZendPHP Hardened Docker Images
ZendPHP and ZendHQ Docker images are hardened to be compliant with CIS Docker benchmarks. Learn more via the button below or get in touch with Perforce Zend today.
Network and Data Protection
Hardening your OS is a critical step, but web applications have a broad attack surface that extends to networking and data storage. Here are a few considerations:
- Network Security — Secure all services, including databases, cache servers, and search engines. For microservices, securing them over the network is paramount. If not properly secured, an attacker can access your data, regardless of OS hardening. Create and lock down virtual networks for your application for comprehensive security architecture.
- Secrets Management — Applications handle sensitive data like PII, service credentials, and API tokens that must be stored securely, never in source code. Utilize secrets management tools like HashiCorp Vault or Doppler to integrate them into your platform deployment workflow, keeping them out of your Git repository and securely vaulted.
- Data Masking and Encryption — Sensitive data requires masking to prevent revealing PII. Many database engines offer direct encryption hooks. Implement end-to-end TLS encryption between your database and application. For testing, tools like Perforce Delphix can mask and generate fake data for development.
Best Practices for Secure PHP Development
With a secure foundation in place, your focus can shift to development. If you are not building a system with security in mind from the outset, you are likely to make decisions that compromise your application.
One way to stay on top of security is by following the OWASP Top Ten. Each year, the Open Web Application Security Project (OWASP) publishes a top ten list of the most exploited vulnerabilities each year. If your team knows about these and thinks about them during development, you can learn how to prevent or mitigate these flaws.
Be sure to also practice proactive PHP dependency management and update all aspects of your application, including the PHP itself. PHP has a patch release every four weeks and an annual feature release in November. Frameworks like Laravel and Symfony often tie their support schedules to PHP's lifecycle. A version of a framework supporting PHP 7.4, for example, is no longer receiving security updates because PHP 7.4 is end-of-life. You must stay on top of updates to ensure the latest security patches are always installed.
Most of all, remember that security is a feature. In order to safeguard your mission-critical applications, you must build time into your roadmap and day-to-day workflows to address it.
Learn More About PHP Security Best Practices
On-Demand Webinar
How to Build a PHP Security Roadmap
Watch along as I walk through how to make a comprehensive PHP security roadmap, including leveraging observability data for more secure applications.
Telemetry Overview: Application Performance Metrics and Security
Once you've built a secure foundation and your application has been deployed, how will you know when security events are occurring? How do you detect brute-force login attempts, user spoofing, credential theft, or denial-of-service (DDoS) attacks? How can you differentiate a malicious actor from a misconfigured API client?
The answer is telemetry.
Telemetry provides three types of application observability: Metrics, logging, and traces.
| Telemetry Type | Purpose |
|---|---|
| Metrics | Provides information regarding the state or behavior of your system over time. |
| Logging | Delivers detailed insights into specific events occurring within the application. |
| Traces | Offers comprehensive visibility into all activities associated with a given request. |
The beauty of introducing telemetry is that it generally requires little to no change to your application code. It can be set up with minimal impact on performance while simultaneously giving you insight into that performance. This is a crucial tool for a comprehensive strategy around application performance monitoring and security.
Metrics
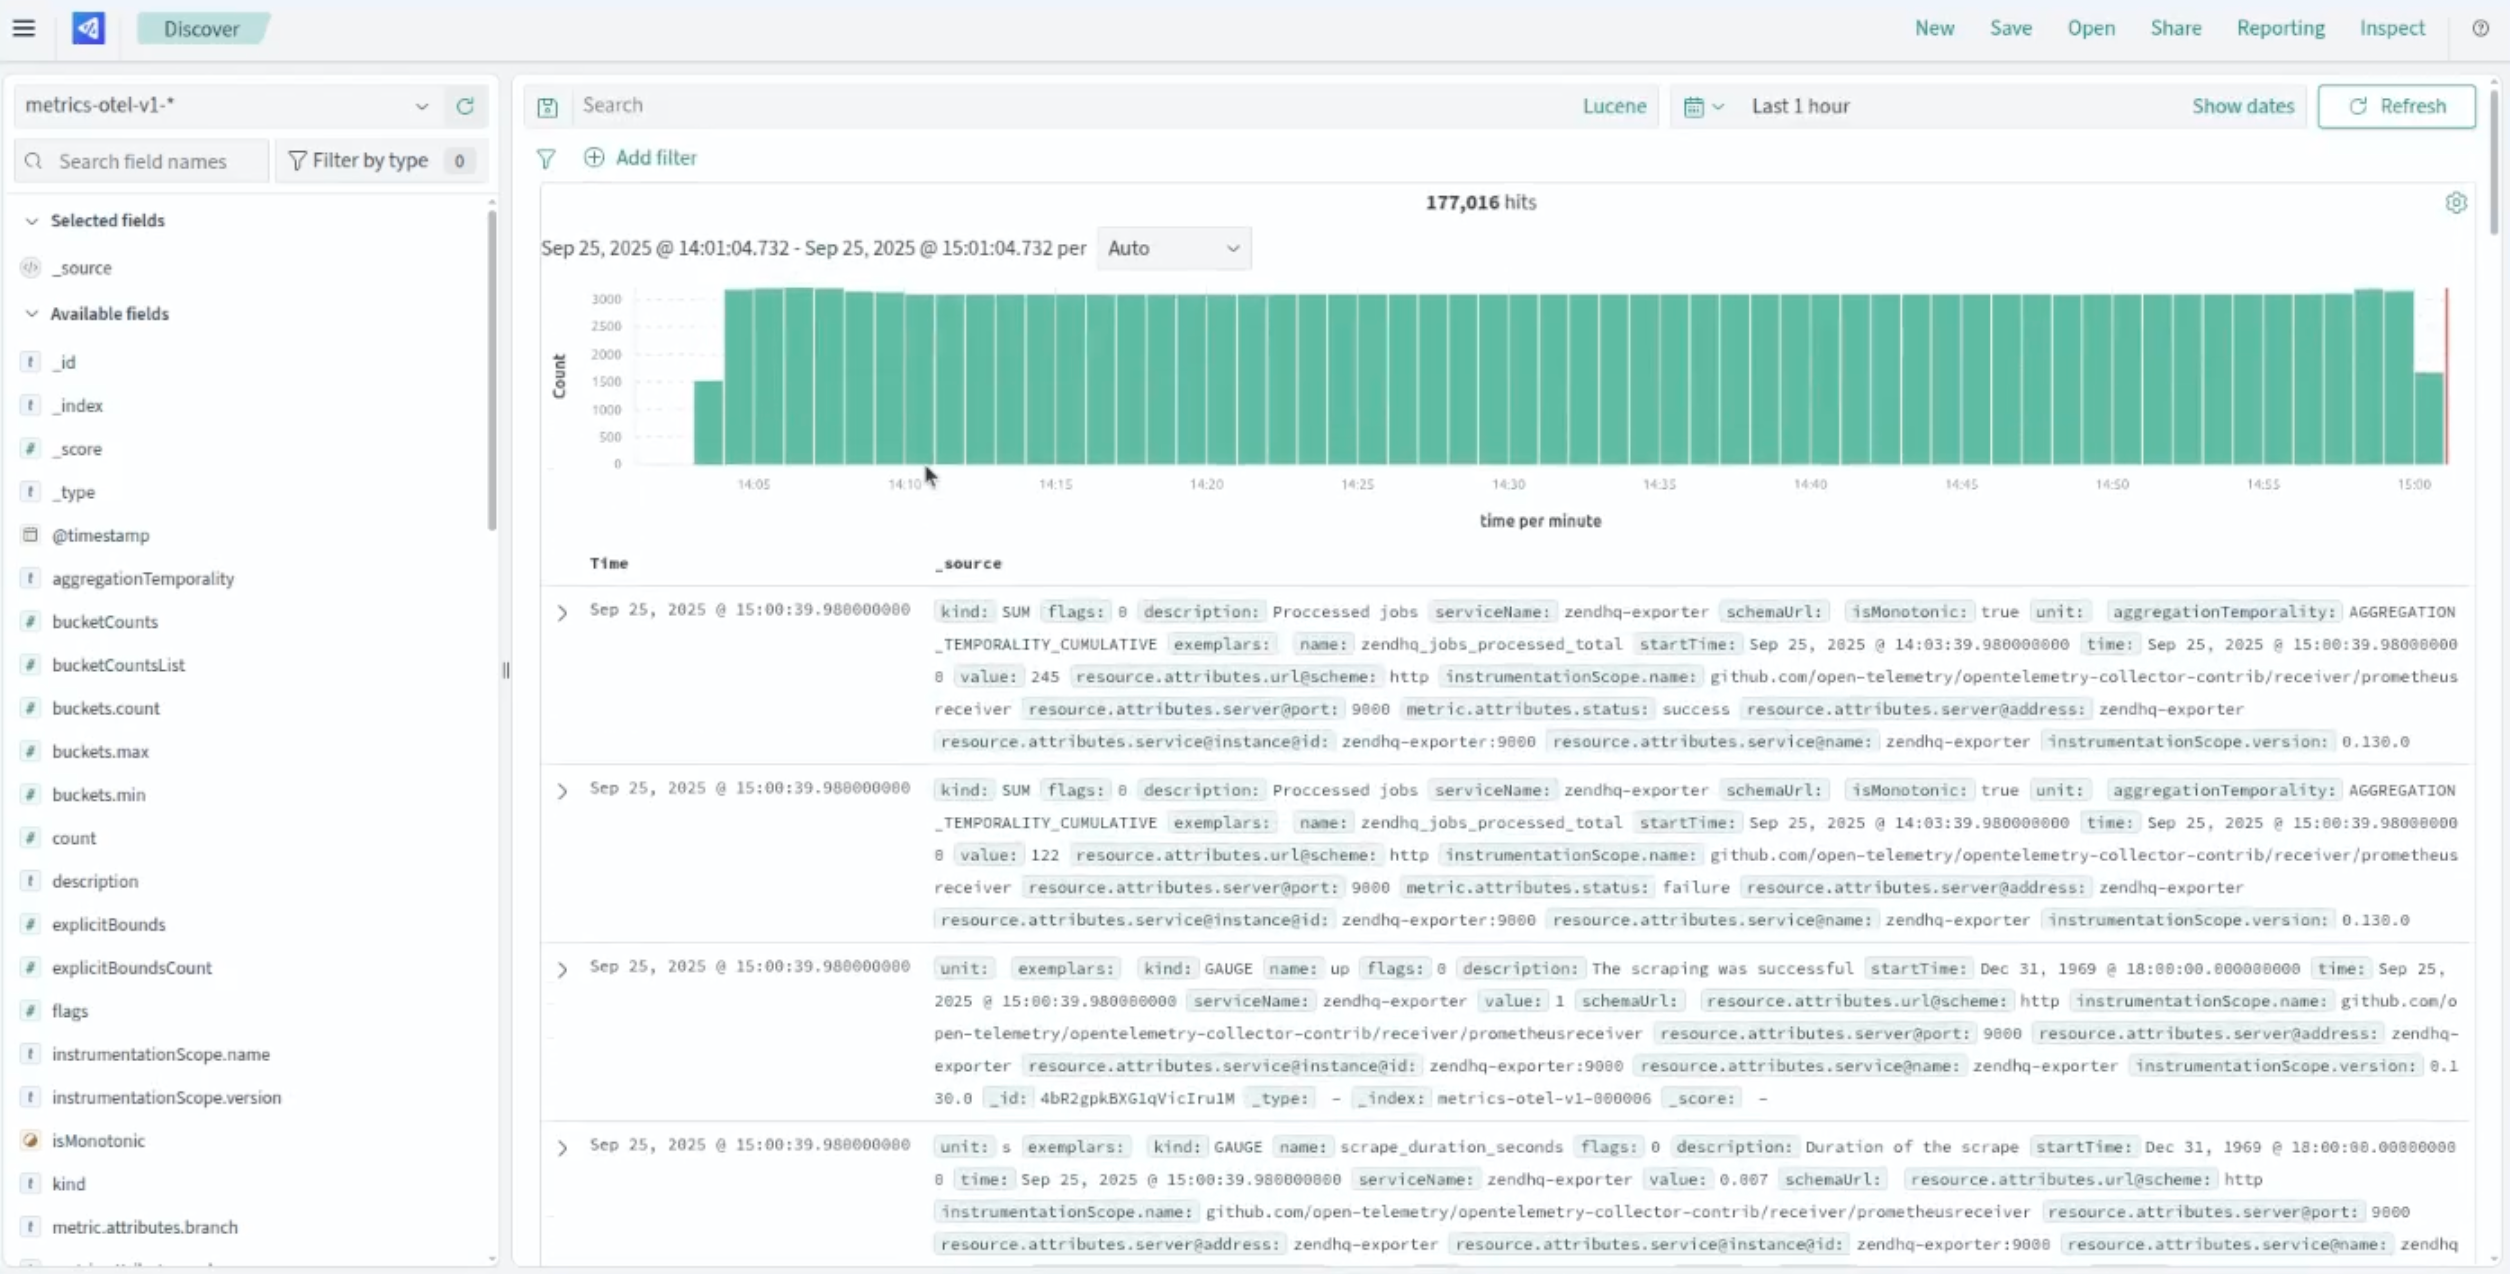
Metrics tell you when something has happened and act as a counter or gauge of how often it has happened. The simplest metric is uptime, but you can measure much more: the number of queries against your database, CPU load over time, or memory usage of your PHP workers. When you measure these over time, you gain insight into application health.
A sudden spike in activity within a specific time range could indicate a coordinated attack. Requests to specific endpoints taking longer than others could signal a potential DDoS vector. High response times that correlate to a large number of database queries might point to an SQL injection attempt or data exfiltration. These web application performance metrics are the canary in the coal mine for your security posture.
Logs
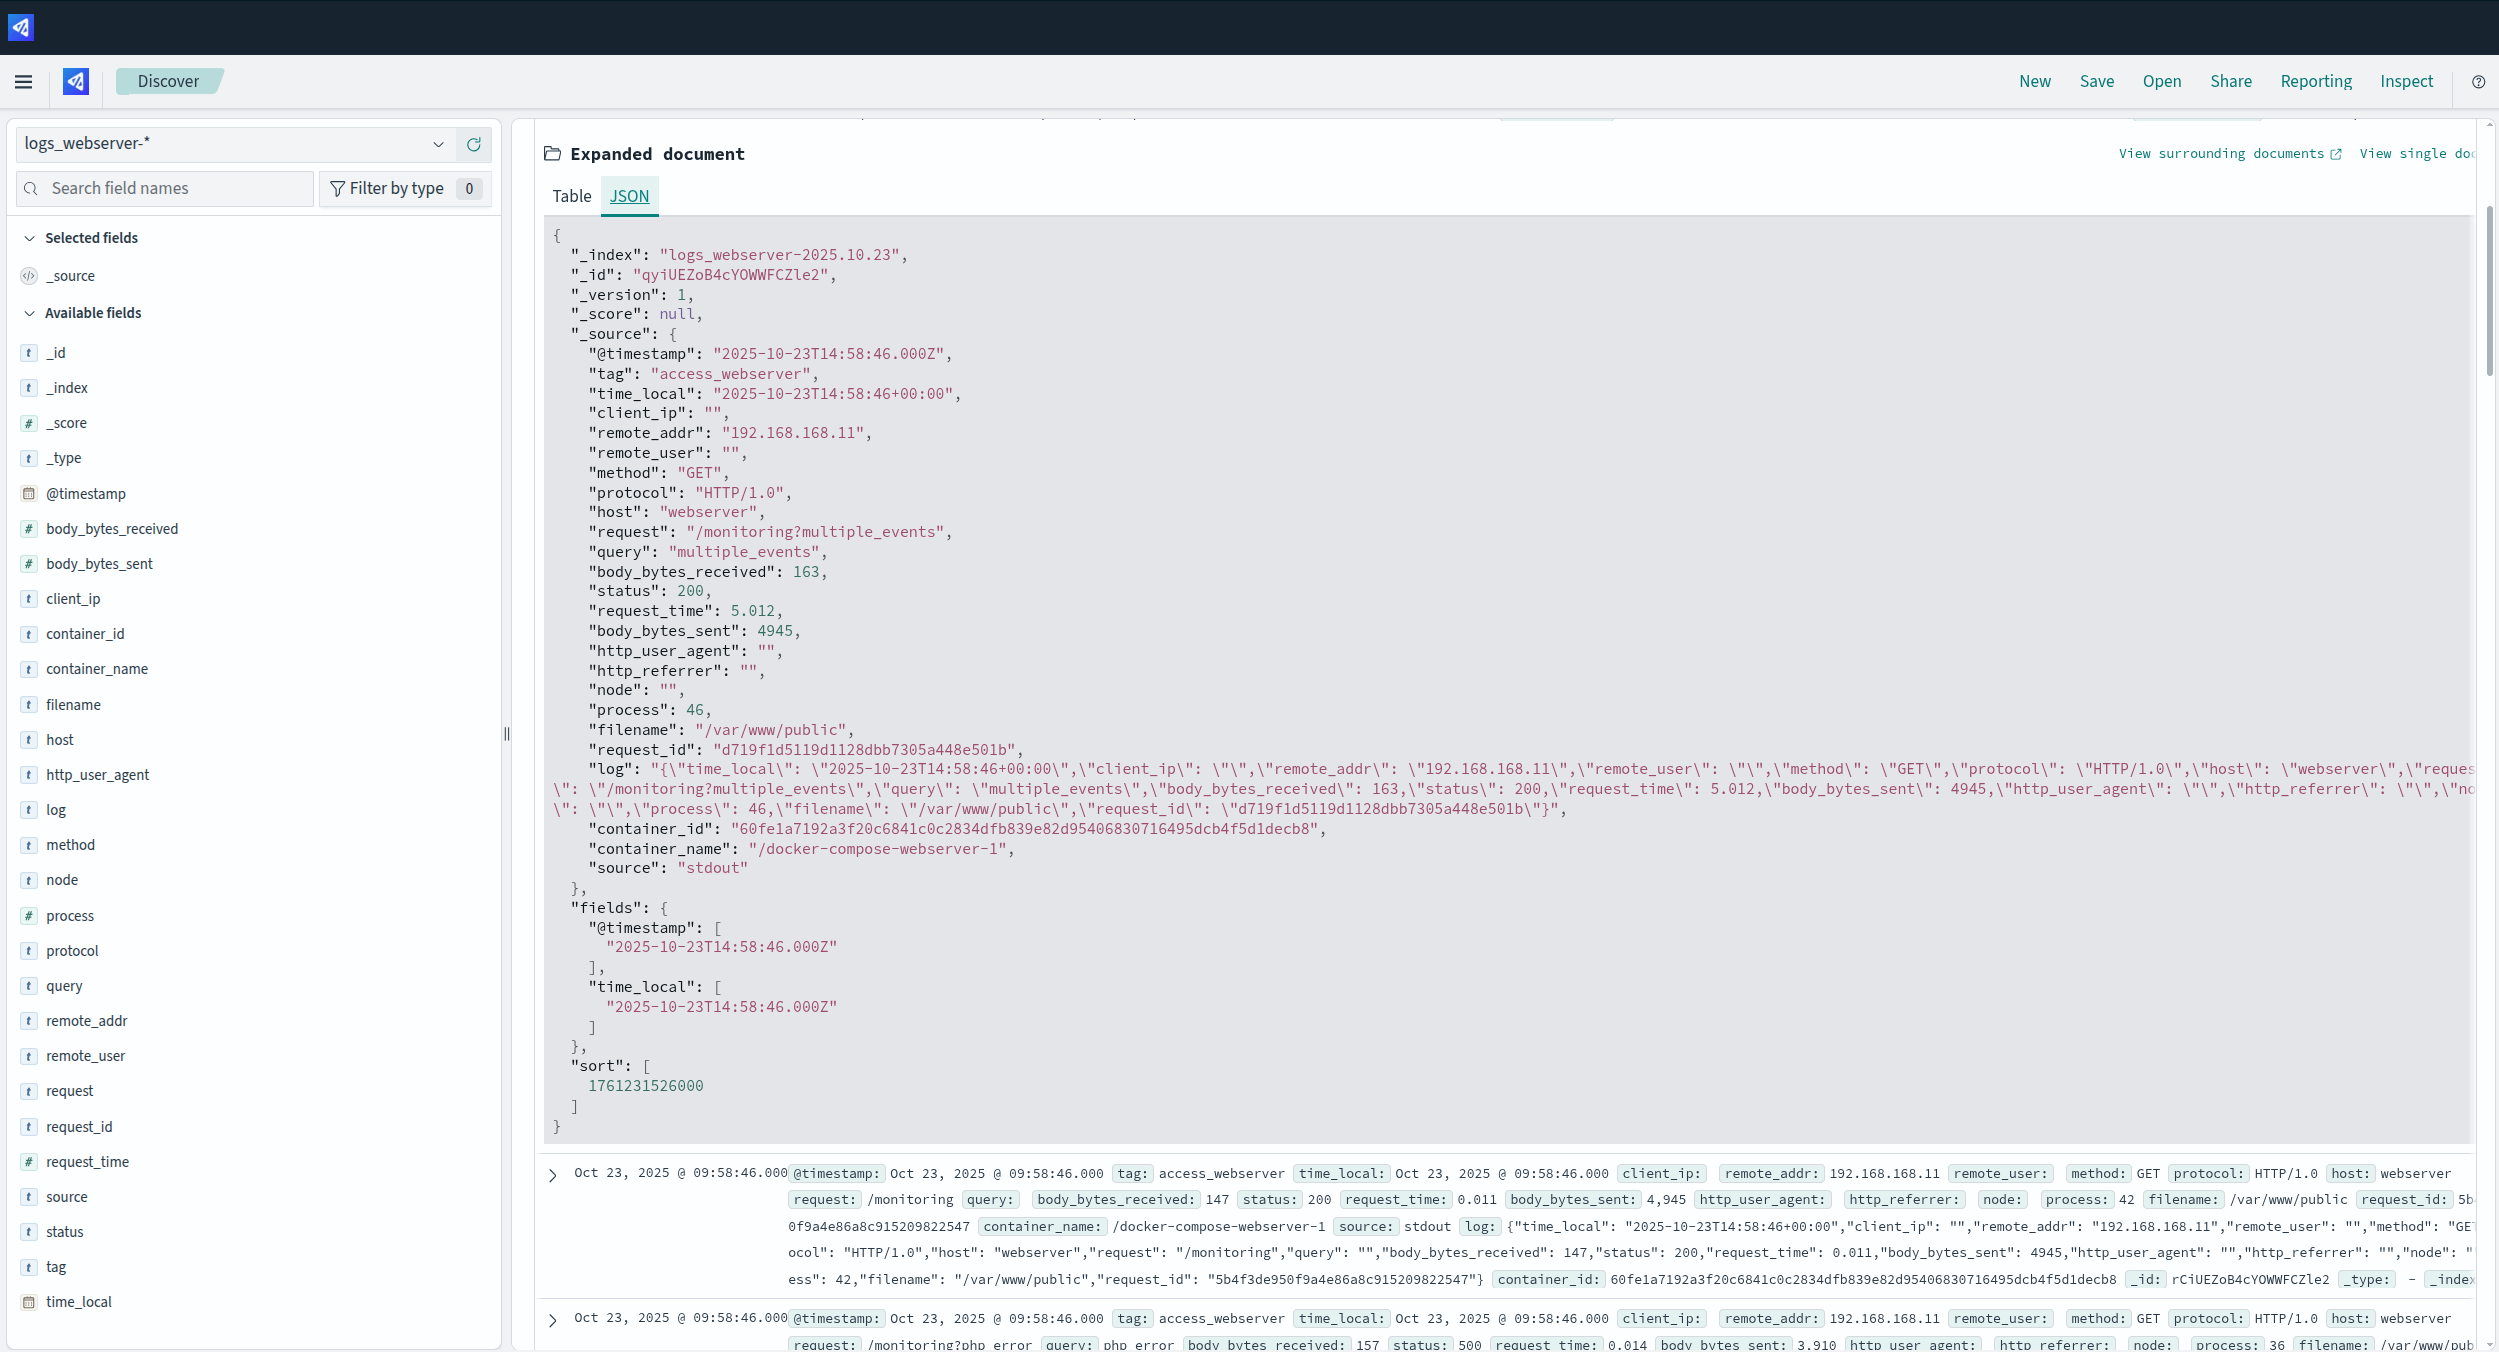
While metrics tell you something happened, logs tell you which specific event happened. Organizations make liberal use of logs from web servers, PHP worker pools, and application-level events like user logins or transaction initiations.
The issue with extensive PHP logging is that it can negatively impact performance and create a lot of noise. It also depends on developers remembering to add logging in relevant locations and ensuring all logs for a given request have a common identifier for grouping.
Code Tracing
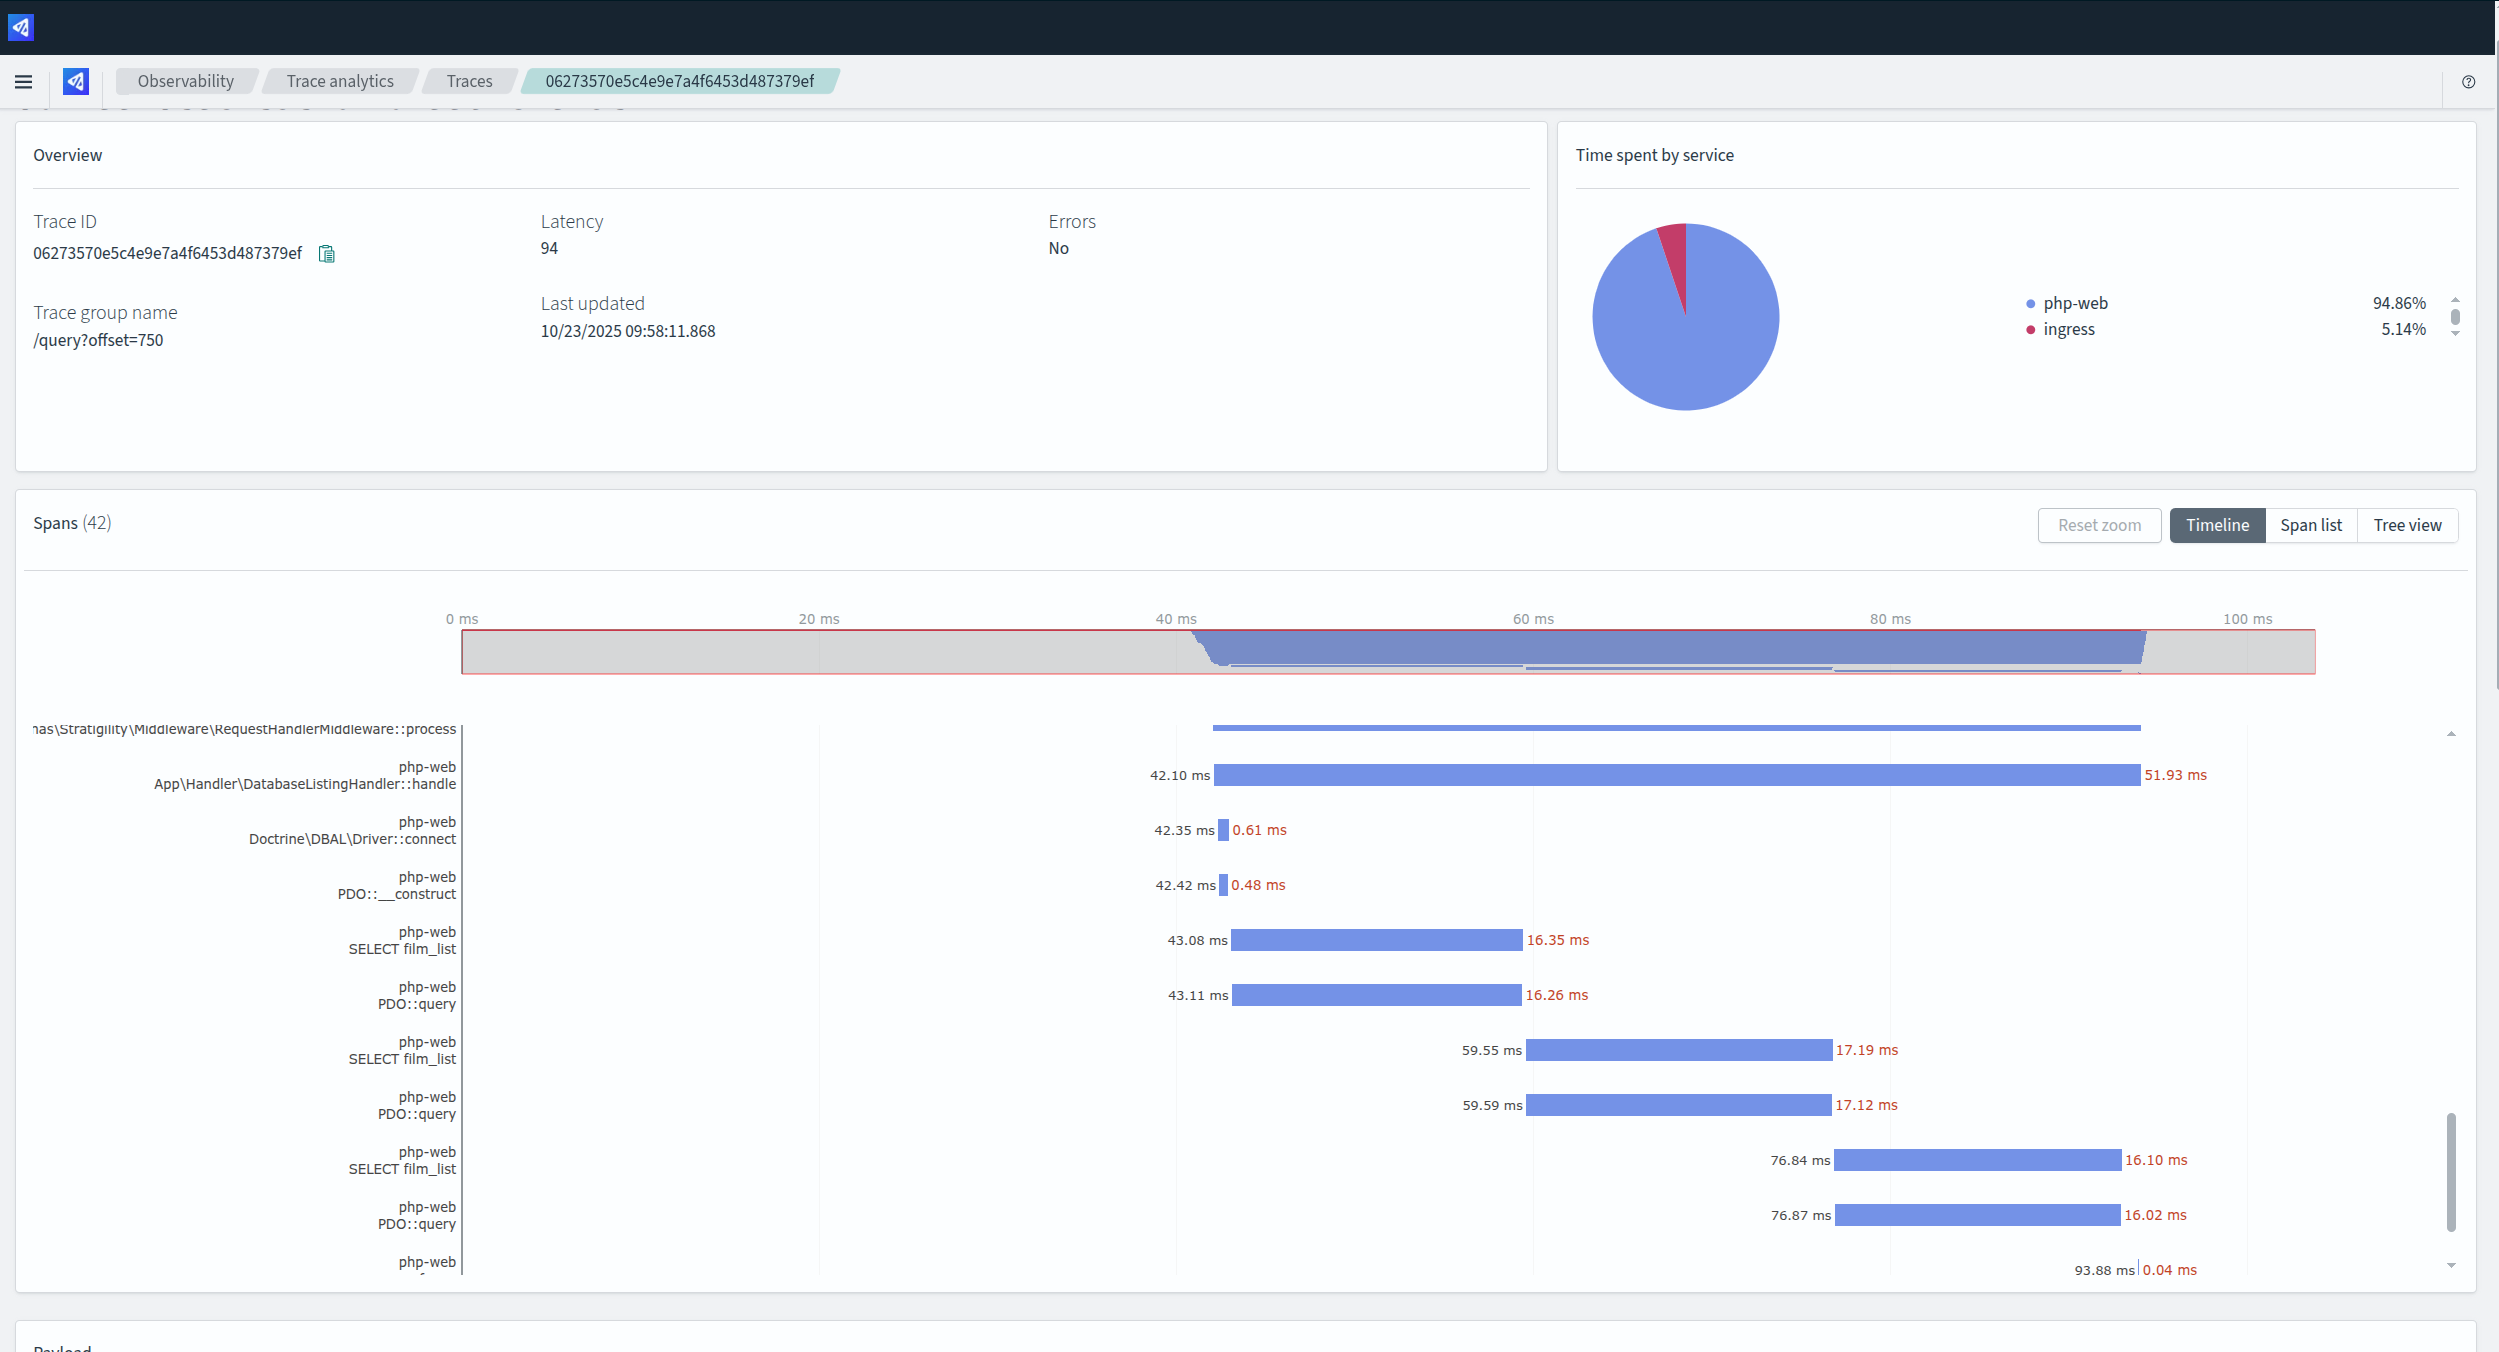
Once you know something has happened, a trace helps you investigate why. Code tracing is initiated at your application ingress (e.g., the web server or load balancer). It propagates an identifier through your system, and each service pushes individual items of information called spans to a collector. This provides an end-to-end view of a request.
With a trace, you can understand everything the request touched, its path through your application, the services it called, and the arguments it provided. Crucially, each span includes timing, so you can see exactly how long each process took. Traces help you profile and debug, allowing you to identify what processes take the longest and what conditions create errors. Eliminating these errors and performance bottlenecks leads to better security by removing common vectors for exploitation.
Back to topOpenTelemetry: The Go-To Choice For PHP Application Performance Metrics and Threat Detection
The gold standard for telemetry is OpenTelemetry, a project sponsored by the Cloud Native Computing Foundation (CNCF). It provides a specification for metrics, logs, and traces, along with a variety of open-source tools. A key component is the OpenTelemetry Collector, which acts as a middleman. Applications push logs and traces to it, and it pulls metrics from providers.
Why Use OpenTelemetry PHP Instrumentation?
What makes OpenTelemetry so powerful for web application performance monitoring and security is its flexibility and versatility. Most application performance monitoring (APM) tools (such as New Relic, Datadog, and AppDynamics) now support OpenTelemetry data. This allows you to install the OpenTelemetry PHP extension instead of relying on a vendor-specific one, effectively preventing vendor lock-in. If you choose to switch APM providers, all you need to do is update where the collector forwards the data, leaving your application infrastructure untouched.
You also have the option of forwarding data to open source services. By hosting your own observability stack, you can use tools like Jaeger for traces and Prometheus or Grafana for metrics, giving you full control over your monitoring setup.
Additionally, the collector can send data directly to storage solutions like OpenSearch or Elastic. These platforms come with built-in utilities for visualizing telemetry data, making it easier to analyze and interpret the performance of your applications.
Deploying OpenTelemetry in PHP Applications
To implement OpenTelemetry in a PHP environment, your developer team will typically need:
- The OpenTelemetry PHP extension (which ZendPHP runtimes provide pre-compiled).
- 2. A transport like gRPC or Protobuf to send the collected OTel data to the OTel collector.
- Note: While you can send gRPC via HTTP, it's best to utilize a dedicated PHP extension for gRPC in conjunction with the OpenTelemetry extension for this purpose, as it massively improves network communication speeds.
- Zero-configuration instrumentation libraries installed via Composer.
Note that auto-telemetry libraries are available for popular frameworks like Laravel and WordPress, tools like Doctrine, and PHP-FIG standards (PSR-3 for logging, PSR-15 for middleware). These provide rich, context-specific trace information, such as the exact SQL query sent to the database.
For performance management, web server integrations for NGINX or Caddy allow you to set a sampling rate (for instance, trace 10% of requests) or trigger traces on demand with a specific header or cookie. This balances deep visibility with performance overhead, giving you actionable insight to keep your application healthy and secure.
Secure and Supported PHP Runtimes
ZendPHP runtimes, when paired with the ZendHQ extension, deliver the building blocks for secure and scalable PHP applications. Upgrade on your schedule, access expert support, and much more.
An All-in-One Solution for Application Performance Monitoring and Security
It is all well and good to have a secure foundation, development practices, and an observable deployment. But assembling these components correctly is a significant challenge. The Zend team has spent hundreds of hours developing a solution because it's not trivial, and documentation is sparse. This is where the Zend Enterprise Web Platform comes in.
The Zend Enterprise Web Platform is a single-source and customizable command center for mission-critical PHP applications. Unifying real-time app metrics, security-first architecture, and simplified scalability, the Zend Enterprise Web Platform brings all PHP services together on one endlessly customizable dashboard.
Here's how it can help improve your PHP security:
- Hardened and Secure Foundation — The platform is built on ZendPHP container images that are hardened according to CIS benchmarks, allowing your team to focus on application-specific security strategies.
- Turnkey Orchestration — The platform provides a virtual network for all services, auto-scaling factors for data and content caching, and web/worker segregation. This ensures your application can scale to meet traffic demands without compromising its ability to serve customers.
- Built-in Telemetry — The platform includes OpenTelemetry and OpenSearch by default. It exposes only the ingress and dashboard services (which we recommend keeping on a private network), dramatically reducing the attack surface. Useful dashboards are available out of the box, giving you immediate insight into your web application performance metrics.
- Flexibility and No Vendor Lock-in — While OpenSearch is built-in, you can easily configure the OpenTelemetry collector to push data to an existing commercial APM you already use. You get a fully integrated, secure, and observable environment without being locked into a single vendor for your application performance monitoring and security.
Secure, scale, and observe mission-critical PHP, all from one easy-to-use command center. Watch this video tutorial to learn more.
Final Thoughts
By unifying a hardened infrastructure with a pre-configured observability stack, the Enterprise Web Platform empowers you to proactively identify issues before they occur. It provides the actionable intelligence needed to improve your early threat detection capabilities without forcing your team to become experts in the complex and time-consuming process of building it all from scratch.
See the Enterprise Web Platform In Action
Make the most of your PHP application performance metrics and improve your security strategy with the Enterprise Web Platform. Discover how it works in your infrastructure by scheduling a demo today.
Schedule a Demo Learn More About the Enterprise Web Platform
Additional Resources
- On-Demand Webinar - Tackling Prevalent PHP Vulnerabilities at Scale
- On-Demand Webinar: Securing and Scaling PHP Applications
- Guide - Getting Started With PHP Security
- Guide - How to Develop Web Applications with PHP
- Blog - GDPR PHP Compliance: Maintaining GDPR for Web Applications
- Blog - Fintech PHP Applications: How PHP Supports the Finance Sector
- Blog - PHP Observability and Monitoring Trends