Blog
February 20, 2019

The IBM i platform has PHP server monitoring tools, but do they provide the best option for monitoring PHP servers? In this blog, we look at why Zend Server may provide the best option.
Back to topPHP Server Monitoring on IBM i: What's Best?
It's important to stay on top of the PHP environment through PHP server monitoring, including aspects such as performance characteristics, memory utilization, errors, and other metrics. There certainly are tools in IBM i, such as Work with System Status (WRKSYSSTS) and Collection Services, that can be used for viewing resource utilization. But are they the best approach?
Back to topZend PHP Server Monitoring
A better approach to resource monitoring for PHP on the IBM i platform is to take advantage of the monitoring capabilities that are part of Zend Server.
The Zend Server monitoring component is integrated into the PHP runtime environment and is designed to provide both alerting and collection capabilities for each detection of PHP script issues as well as issues with the server that PHP is running on.
The intent of the monitoring functions is to help streamline the root-cause analysis of issues in the environment by providing relevant information, including errors, failing functions, slow script execution, database errors, and high memory utilization – just to name a few.
Back to topZend PHP Server Monitoring Features
So what does PHP server monitoring with Zend Server look like? In the following sections, we look at the various PHP server monitoring features in Zend Server, and
PHP Server Monitoring Dashboard
Let's start with a broad look at PHP server monitoring with Zend Server. The first place to stop on our tour is the Dashboard that is provided by Zend Server:
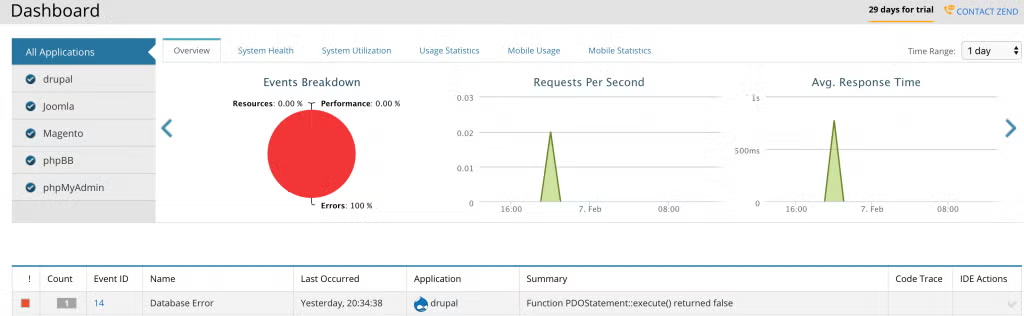
As you can see, the Dashboard provides a wealth of information, including items such as events that have been encountered by the PHP engine and performance metrics such as the number of requests per second, the average response time, system health and utilization, statistical information related to usage, and mobile information including usage and statistics.
Notice on the left-hand side that the information displayed on the dashboard can cover the entire PHP environment or can be filtered by application. I'm going to cover application management in more detail in a subsequent blog; however, it's important to know for this topic that applications become "known" to Zend Server in one of two ways:
- Installation of the application via the Zend Server application management capability.
- Identification of an application through definition/mapping of a name to a base URL for the application.
No changes need to be made to the application in order to be able to monitor it – monitoring occurs via the Zend Server monitoring component within the PHP runtime environment, and that information is reported/captured by Zend Server.
Event Rules
Digging deeper into the Zend Server monitoring capabilities takes us to the ability to define monitoring metrics and actions to take when those metrics are exceeded. To show an example of that, we will go into the "Monitoring > Event Rules" area of Zend Server:
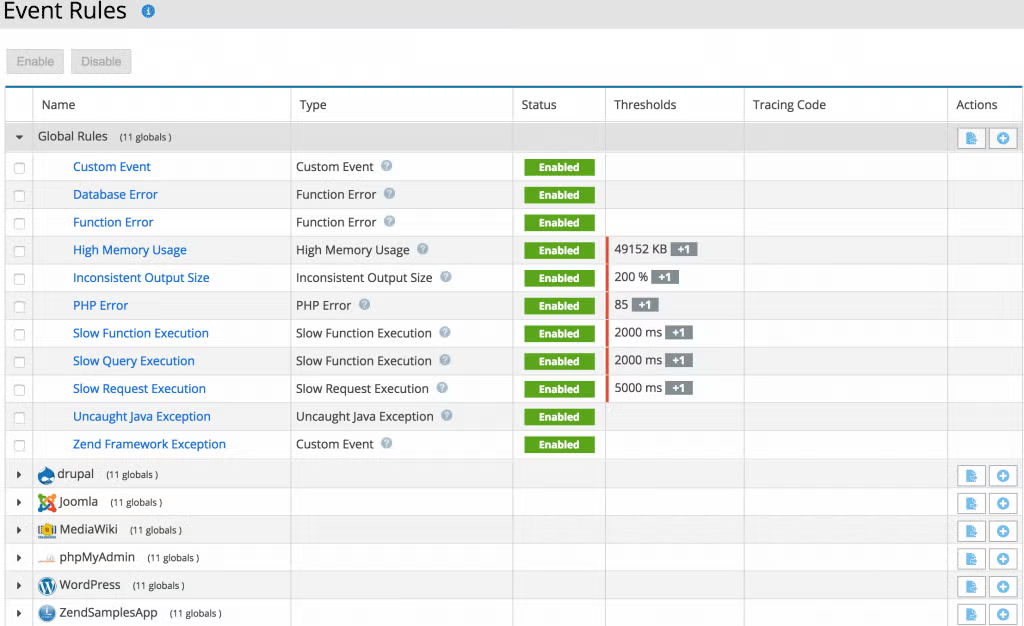
As you can see, there are a number of monitored events that thresholds can be set for. Additionally, take note of the ability to define those thresholds at both the global level as well as the individual application level.
A threshold set at the application level overrides the global threshold for that event for that application. To get a handle on how event monitoring works, let's take a look at the threshold definition of the "High Memory Usage" event:
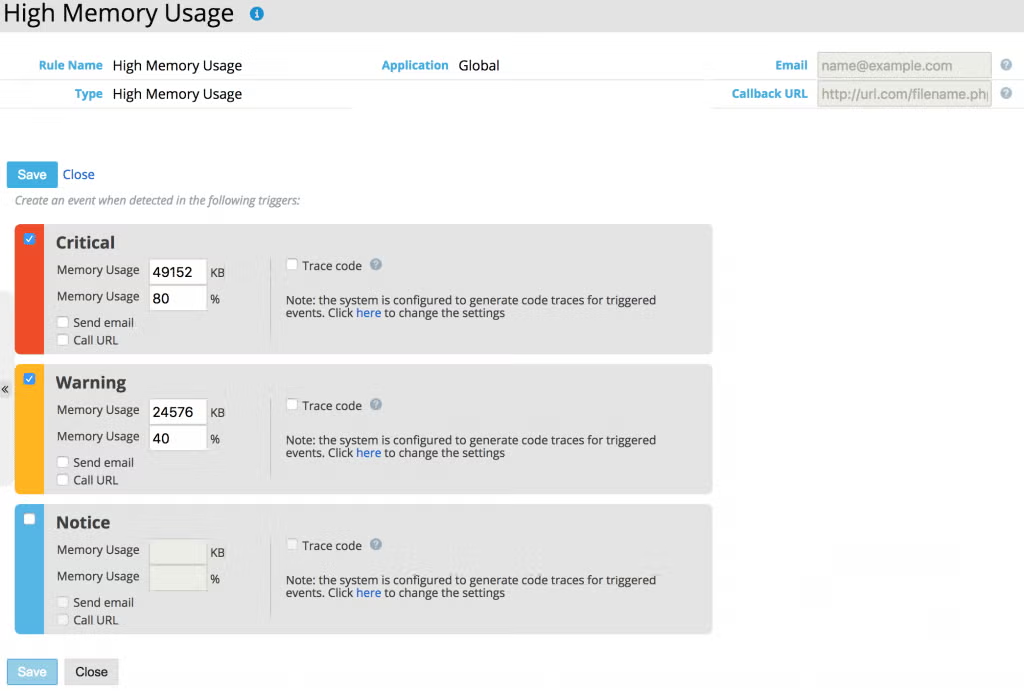
As you can see, thresholds can be set for notices, warnings, and critical levels, and for each level, three actions can be taken: sending an email, invoking a callback URL, and generating a code trace. The sending an email action is fairly self-explanatory in that an email is sent to the defined email address when the event is triggered. The "Call URL" causes the indicated script (Callback URL) to be executed when the event is triggered.
The "Trace code" action causes a code trace for the PHP script being executed to be generated at the time the event is triggered – this can be useful in the analysis of the condition that caused the event in that the trace can be viewed to see where in the application processing the event occurred, values of variables at the time of the event, and functions that were invoked.
In addition to the pre-defined events, there is also the ability to have a custom event and related event handler. The PHP language includes the function call zend_monitor_custom_event() which can be used to raise an event. The "Custom Event" rule in Zend Server can then be used to take an action when that event is raised.
One way that this can be useful is when you want to have a custom for a code condition rather than the condition have the default action for the event to take place.
URL Insight
Another area of PHP server monitoring available within Zend Server is called "URL Insight":
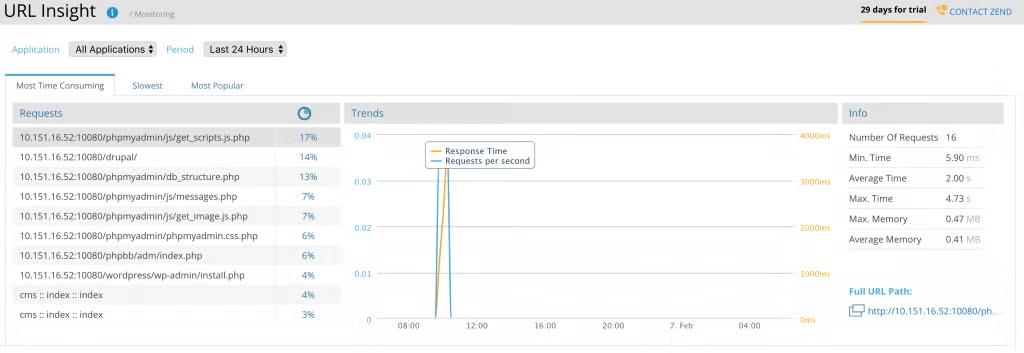
As you can see from the screen shot above, URL Insight provides performance information for URL requests that have been processed by PHP. From the URL Insight's page, detailed reports and information for specific PHP requests processed by the web server can be viewed. The available information can be segmented by the "Most Time Consuming," "Slowest," and "Most Popular."
Editions
As indicated in the introductory blog to this series, different editions of Zend Server provide different functionality. The monitoring functions available in the different editions of Zend Server are summarized in the following table:
| Edition | |||
| Monitoring function | Basic | Professional | Enterprise |
| Runtime Trending Dashboards | Yes | Yes | Yes |
| Application Monitoring | Yes | Yes | Yes |
| URL Insight | No | Yes | Yes |
| Custom Events | No | Yes | Yes |
| Event Alerting | No | Yes | Yes |
Final Thoughts
All of the PHP server monitoring capabilities in Zend Server are there to provide an accurate view of how the server and application(s) are performing and to provide notification and take action when monitored events are encountered.
The PHP server monitoring functions are designed to help ensure a healthy and properly functioning web/PHP environment.
If you are a Zend Server customer, you may be surprised that Z-Ray wasn't covered in this monitoring blog – Z-Ray will be covered on its own in a later blog in this series.
Back to topConnect With a Zend Expert
Zend is here to help you get the most out of your Zend Server/PHP environment on IBM i. If you would like more information on Zend Server or perhaps a demo of its functionality, feel free to reach out to us via the link below!