Blog
July 31, 2025
PHP Alerts: Building Custom Alerts with ZendHQ and OpenTelemetry Tools

PHP Development,
Productivity
PHP alerts are vital, but with increasingly complex PHP apps working within an equally complex ecosystem, many teams are searching for a way to minimize the noise and highlight the alerts that matter most. One solution is to combine ZendHQ, an observability extension for ZendPHP runtimes, with OpenTelemetry to tailor alerts to your team's exact needs.
In this blog, I explore why custom PHP alerts matter, and explain how ZendHQ and OpenTelemetry enable effective alerting for developer teams. Then I walk through how to integrate ZendHQ with existing OpenTelemetry PHP tools to build a custom PHP alert system for your critical applications.
Back to topPHP Alerts: Why Custom Curation Matters
Application Performance Monitoring (APM) can be a huge benefit to your apps, as it can help you identify service availability, potential performance bottlenecks, and more. However, you can quickly get notification fatigue. There's so much you can monitor that without adequate filters, you'll be bombarded with alerts.
If you look at PHP, its error handling system categorizes errors as debug information, notices, warnings, deprecations, and fatal errors; not all of these need to be dealt with in the same way. Additionally, most frameworks will take exceptions and convert them into errors — but, again, not all exceptions need to be handled the same way. A form validation exception might be expected, but inability to connect to a database or web service could be indicative of larger problems.
Having a way to filter these can increase the productivity of your team and allow them to focus on what really matters.
Flag Errors Before They Become Problems
Is a warning an error? Maybe not, but consider: inability to read or write to a file can generate a warning, and this may indicate that file uploads are not completing, or that a template cannot be read. The cURL library generates warnings for a variety of issues; warnings in this context could indicate a web service or API is inaccessible.
Identifying these scenarios early can ensure your team mitigates issues that affect your customers.
Avoid Security Risks and Vulnerability Exposures
A common approach by attackers is to brute force logins. Hopefully you've built in some rate limiting or back off algorithms on your authentication to help reduce these vectors — but even if you have, how will you know when they are occurring?
When a PHP security release occurs, and it has patches for your database support, how will you know if you are affected? Logs and alerts can provide some early hints, as most of these will lead to some sort of error that you may be able to detect ahead of time and mitigate.
Reduce Alert Fatigue in Your Developer Team
Most importantly, however, you need to be able to filter out what is important for your team right now, versus those items that might be a problem, but will need more data and investigation to verify.
Having a system to categorize different error types and raise notifications to appropriate teams only as needed can relieve pressure, and allow teams to focus efforts where they are needed, as they have time.
On-Demand Webinar
How to Optimize Modern PHP Applications
ZendPHP runtimes and the ZendHQ extension support and secure your mission-critical web apps. Learn more by watching this on-demand webinar, or try both free to see how they fit in your infrastructure.
ZendHQ and OpenTelemetry PHP Tools: Overview
Before we get into how to integrate ZendHQ with OpenTelemetry instrumentation, let's take a deeper look at what each of these tools have to offer. First, defining telemetry. Telemetry in PHP applications refers to three things:
- Metrics: Any measurement of a service captured at runtime. This could be whether the service is up or down, number of errors, count of events, and more.
- Logs: Any timestamped message emitted by a service. These may or may not be useful in and of themselves, but they are a powerful tool when combined with the other aspects of telemetry
- Traces: Visibility of a single request as it propagates through the entire system. A trace records the path taken by a request through an application, and consists of one or more spans, which provide context to a given operation. (An individual log message is often a span within a trace.)
About OpenTelemetry
OpenTelemetry is an open source observability framework. Providing a vendor-neutral set of tools, APIs, and SDKs, it collects and exports telemetry data from applications and application infrastructure, OpenTelemetry is often cited as the gold standard for PHP monitoring.
OpenTelemetry PHP Tools
A number of Open Source and commercial offerings consume OpenTelemetry, and there are generally a variety of tools that can provide metrics, traces, and logs to OpenTelemetry PHP tooling.
Many commercial APM offerings act as a Software-as-a-Service (SaaS) for consuming traces or polling for metrics and logs, and allow you to install agents in your own infrastructure that forward this information to them, where you can then configure dashboards, set up alerts, and more.
These can definitely give you a leg up, but because they tend to be generic, you will need to spend time familiarizing yourself with the systems, setting up integrations for alerting (e.g., with Slack, an email gateway, PagerDuty, etc.), and identifying what information is actually useful and actionable.
Depending on the complexity of your application, the amount you want to pay, and the privacy/security posture you need to adopt, a SaaS solution might not be for you. If that's the case, there are a number of on premise solutions you can use, both commercially and as open source software. The most commonly used ones are Jaeger for tracing, Prometheus for metrics, and Loki for logging.
OpenTelemetry Collector for PHP
You can also use the official OpenTelemetry collector to poll services for metrics and receive traces, configuring it with backends such as the ones already listed, or even Elastic or OpenSearch. This gives you the flexibility to change your aggregation services in the future, so that if you want to switch from a commercial provider to something you host on premises, you can. It also allows changing what visualization tools you use — for instance, you could switch from Grafana to Kibana or OpenSearch Dashboards.
But how can you reduce the notifications your application raises, or that you've routed those issues to the correct team? How do you ensure that only the urgent items are acted on immediately? This is where ZendHQ and OpenTelemetry come into the picture.
About ZendHQ
ZendHQ is a commercial offering from Perforce Zend that provides a number of observability tools (Z-Ray, event monitoring, and code tracing), as well as a JobQueue for scaling your application. Because it is built specifically for PHP, it provides a number of tools that allow you to curate what interests your team.
When it comes to observability and PHP alerts, you can define events that interest you, based on specific trigger conditions:
- Function errors: By default, the rule monitors a handful of internal PHP file and network functions, but you can define your own list of functions to monitor in this way.
- Database errors: Triggered whenever a supported database extension or PDO encounters an error condition.
- Slow query execution: Triggered when a supported database extension's query function or a PDO query is executed, and takes longer than the specified threshold.
- Slow request execution: Triggered when the duration of the request lifecycle takes longer than the specified time threshold.
- High memory usage: Triggered whenever the memory consumed during a request takes more than the configured memory threshold.
- PHP Error: Triggered whenever a PHP error occurs; you can define which PHP error severity level(s) (e.g.
E_WARNING,E_USER_ERROR,E_RECOVERABLE_ERROR, etc.) are of interest. - Custom event: Triggered whenever your own code calls the ZendHQ extension's
monitor_custom_event()ormonitor_custom_event_ex()functions.
Each of these allow you to assign a severity with the trigger condition. For instance, you might define a high memory usage condition where a notice is triggered if the memory usage exceeds 2MB, a warning is triggered when it exceeds 8MB, and a critical condition is triggered when it exceeds 16MB. This allows you to group your events by severity, which allows your team to determine what is most important.
Additionally, you can configure events to notify a webhook. When the event is created, the webhook will be notified with the event details, allowing you to take additional action. A common use case for this is to configure email or Slack notifications.
Setting Alerts in PHP Using ZendHQ With OpenTelemetry PHP Tools
ZendHQ delivers valuable insights that complement existing APM tooling, allowing you to improve and refine your PHP monitoring practices without replatforming. And, because Zend is aware that you may already have OpenTelemetry-capable tooling, we also provide a metrics exporter. This allows you to configure monitoring events in ZendHQ, and then react to those from our existing tooling.
The exporter connects to the ZendHQ daemon, and exposes a web service that your OpenTelemetry collector can poll for metrics. The ZendHQ OpenTelemetry tooling is only available to ZendHQ customers; please contact support or your sales representative if you need access to the tooling.
Back to topCreating PHP Alerts With ZendHQ and OpenTelemetry
For purposes of this example, we'll be using the following:
- ZendHQ
- ZendPHP, with the ZendHQ extension installed, and pointing to our ZendHQ instance
- A separate container running our ZendHQ OpenTelemetry tooling, connecting to the ZendHQ instance, and exposing a web service; we'll call this node "zendhq-exporter" within the example.
- An OpenTelemetry collector.
- A DataPrepper instance for normalizing and aggregating metrics scraped by the OpenTelemetry collector, and pushing to OpenSearch to store the metrics.
- OpenSearch Dashboards for creating dashboards and notifications.
On-Demand Assistance for Integrating ZendHQ and OpenTelemetry
Setting up all of these pieces takes time, expertise, and available resources. With Zend PHP services, you unlock professional support from an experienced team of PHP experts. Click the button below to learn more about your options, or contact us to get started.
1. Define ZendHQ Monitoring Rules
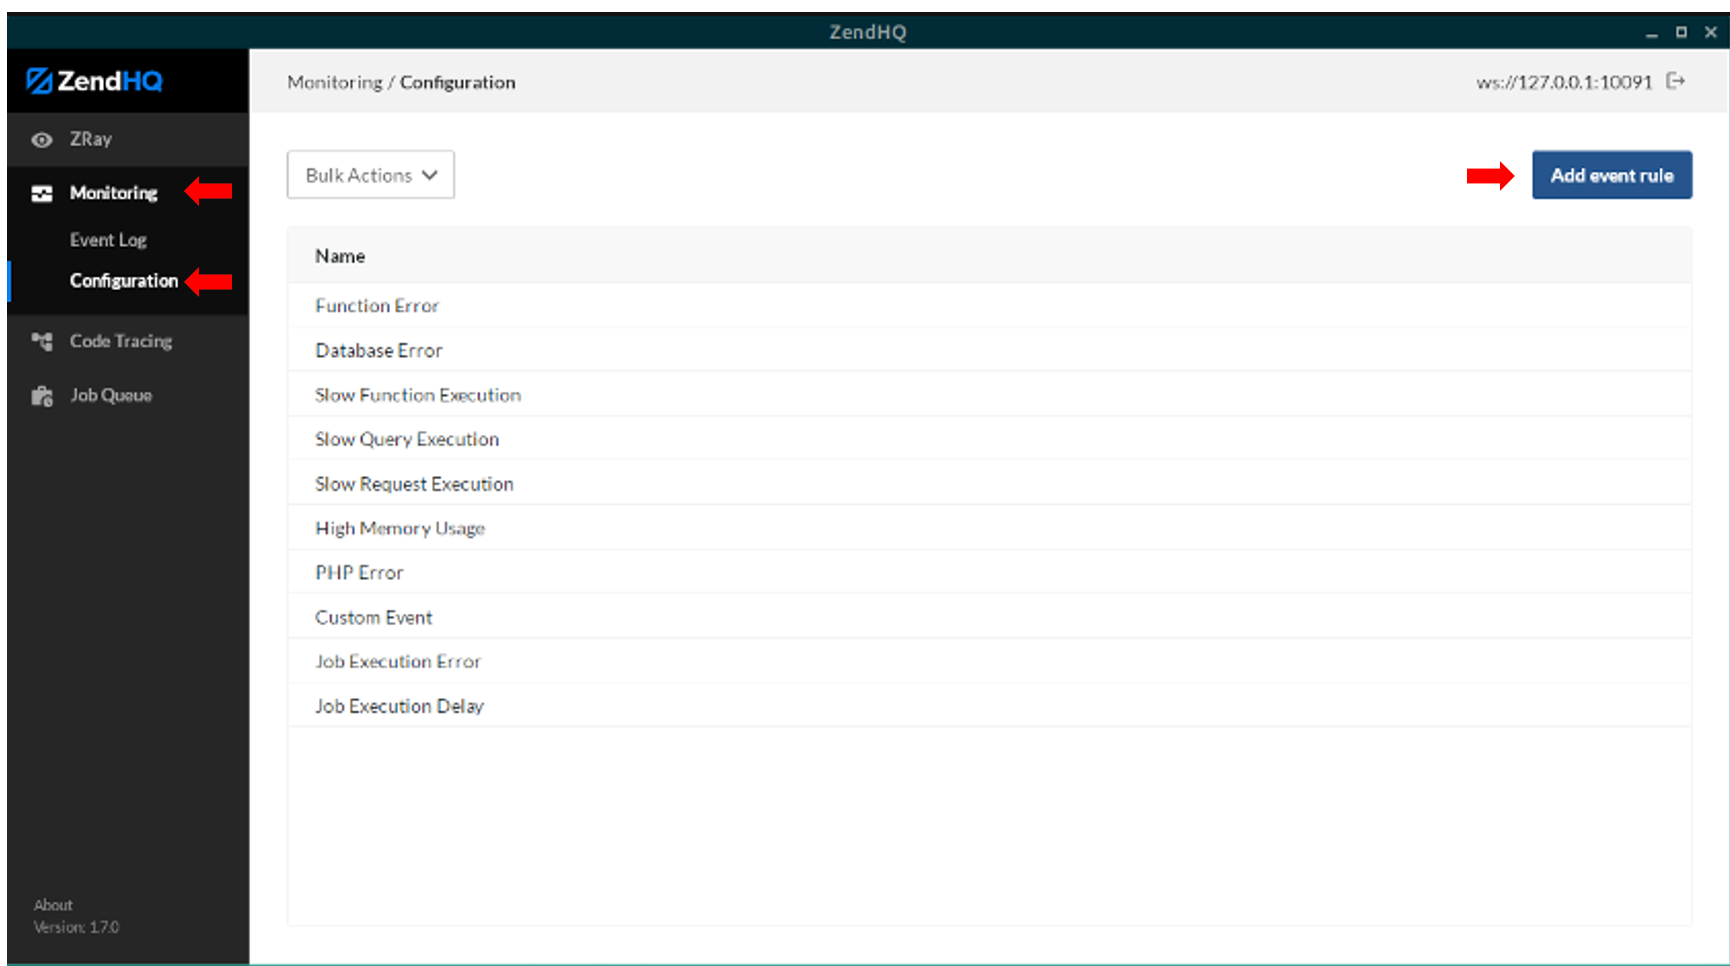
First, we will setup some events. Launch your ZendHQ GUI, and go to the "Monitoring -> Configuration" screen, and then select the "Add event rule" button in the top right.
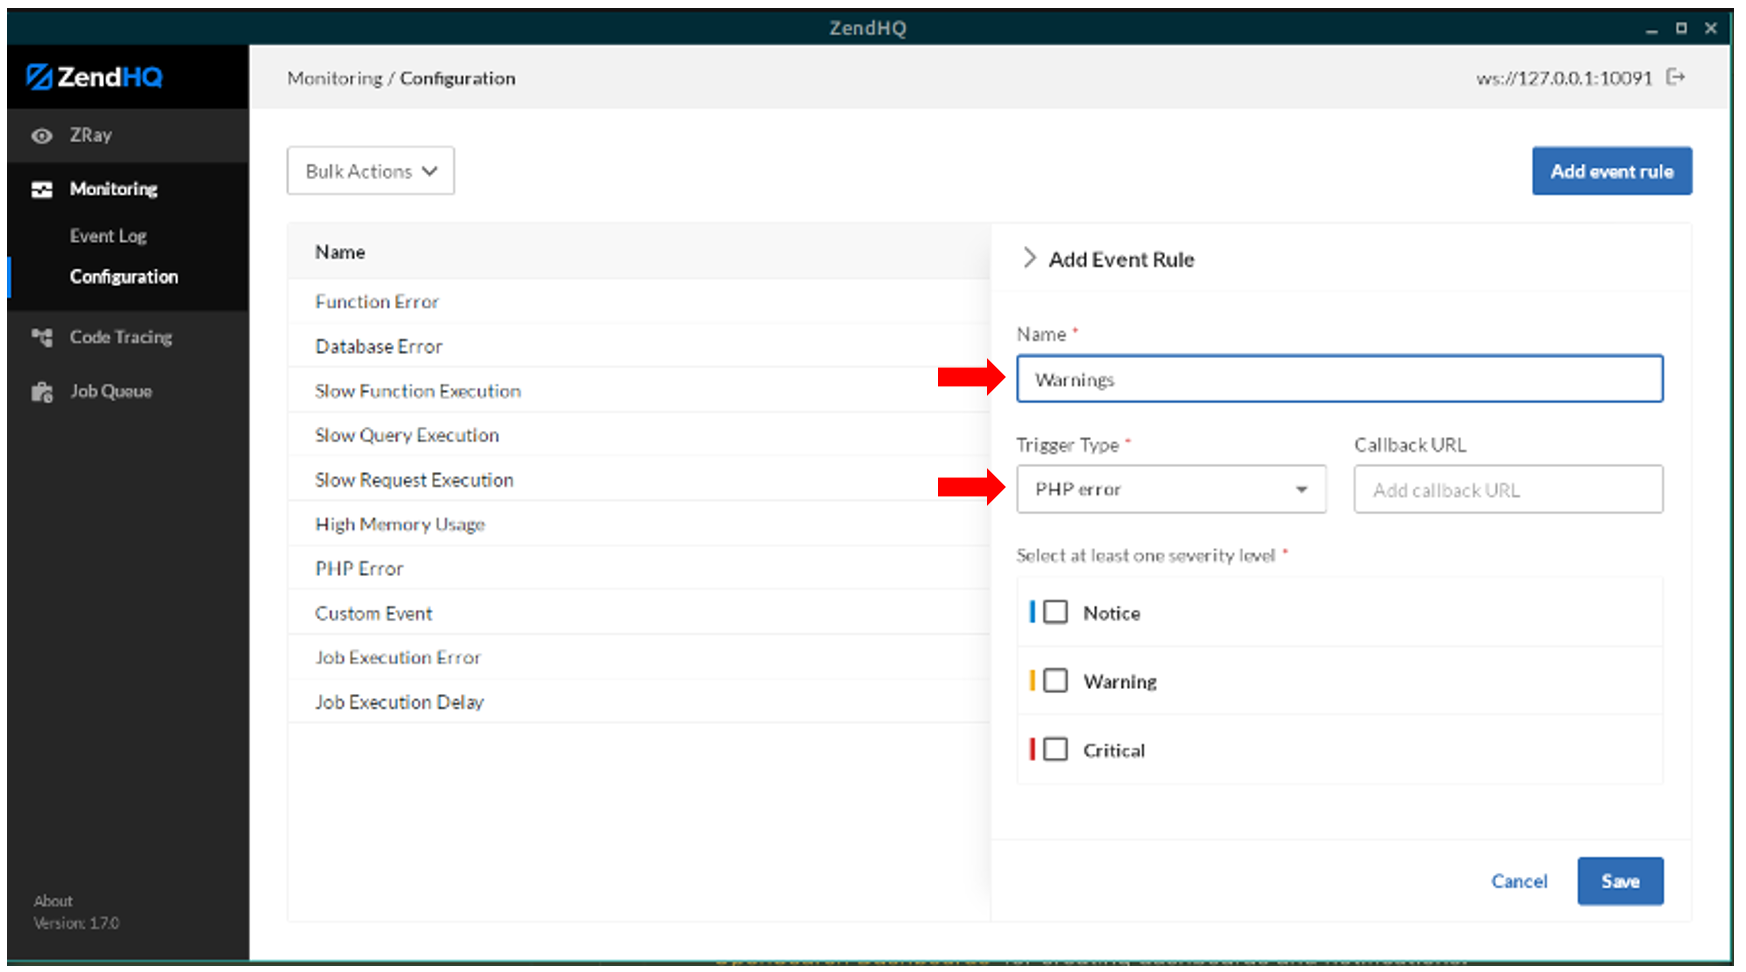
Next, we'll create an event rule named "Warnings" with a trigger type of "PHP Error" as shown below.
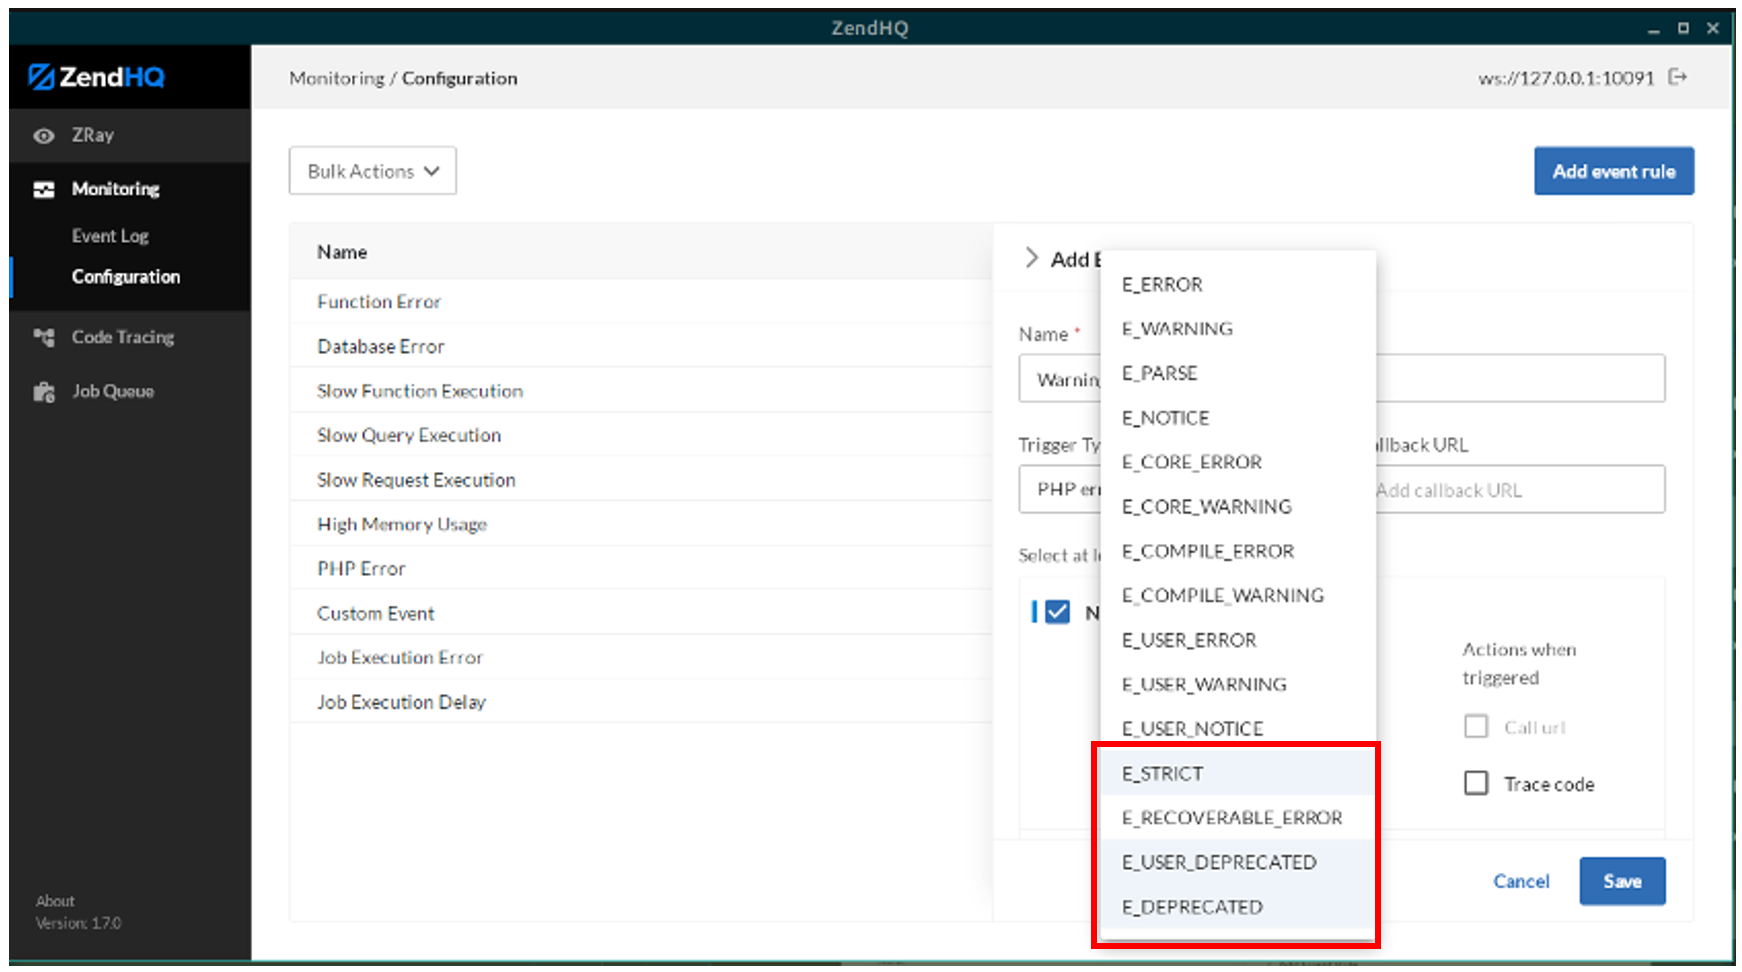
From here, let's select a severity of "Notice," which will then give us a multi-selection for PHP error types; let's choose all deprecation types, as well as E_STRICT. We can use this to group notifications where we may have some modernization or refactoring work to improve our application.
2. Define a Webhook for Creating Notifications
Next, let's setup a webhook URL. I won't go into writing a webhook, but you can use one of the examples linked to earlier as a callback. We'll assume the callback is at http://webhook-host/zendhq/php-error.
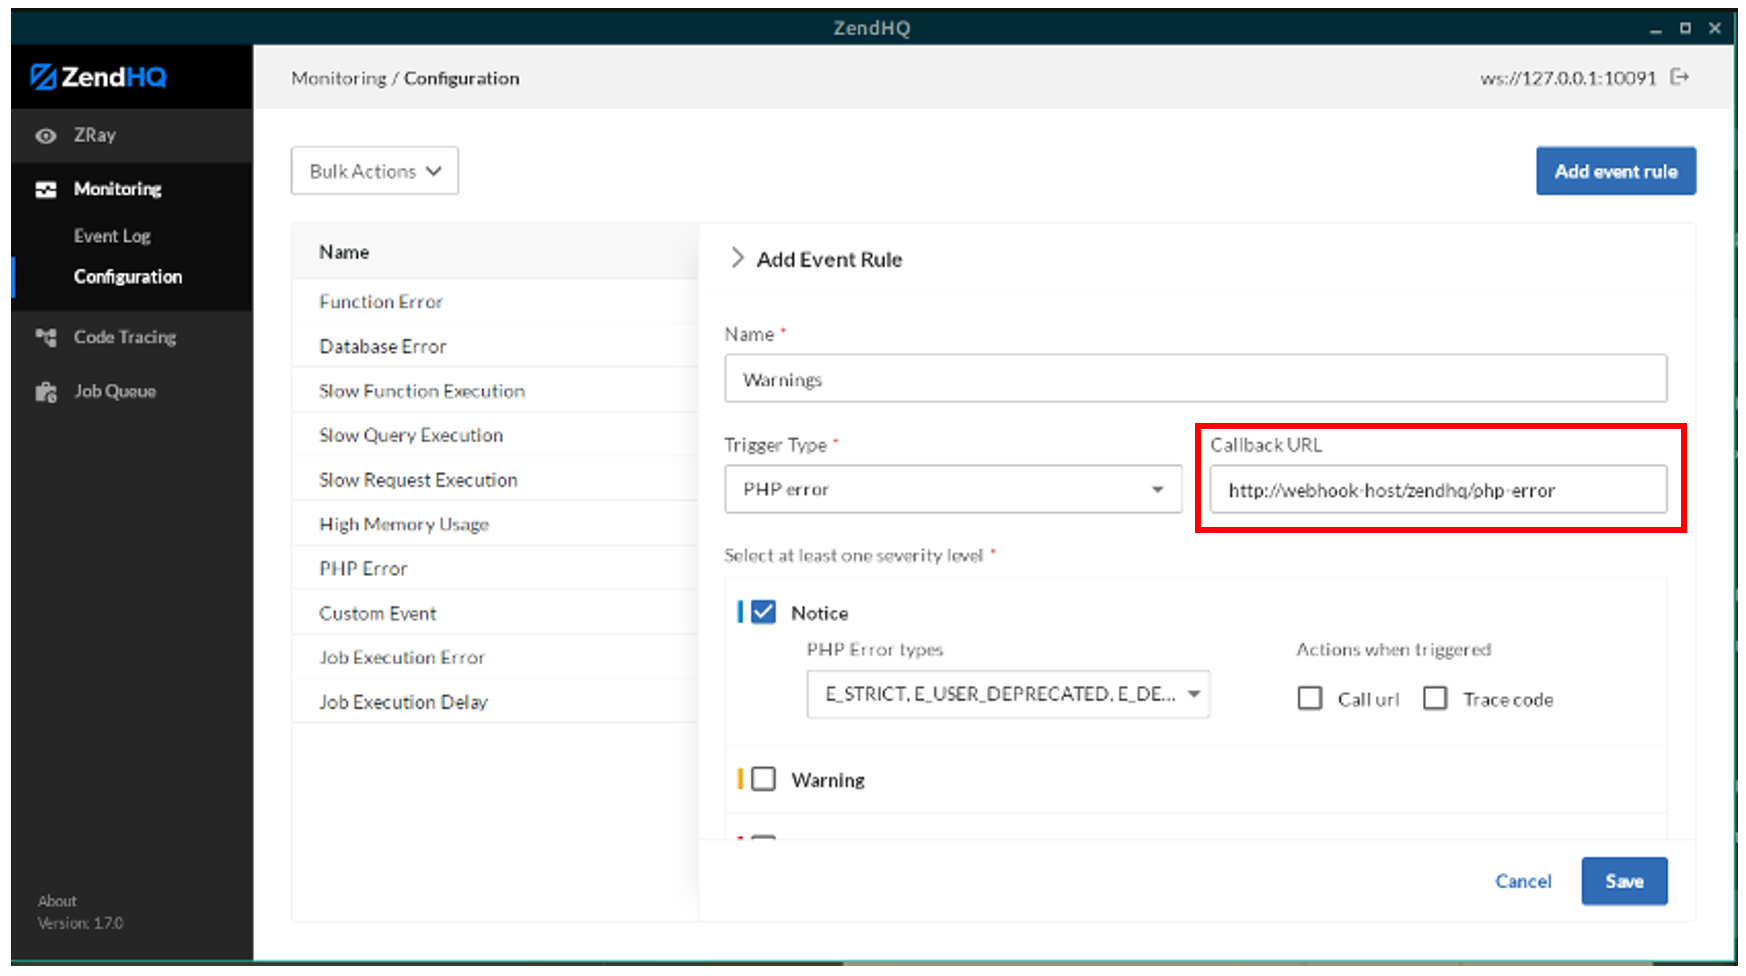
Next, we'll select a severity of "Warning," and use the multi-select to select all warning types. For this one, we'll have it call the webhook URL, by selecting the "Call url" checkbox.
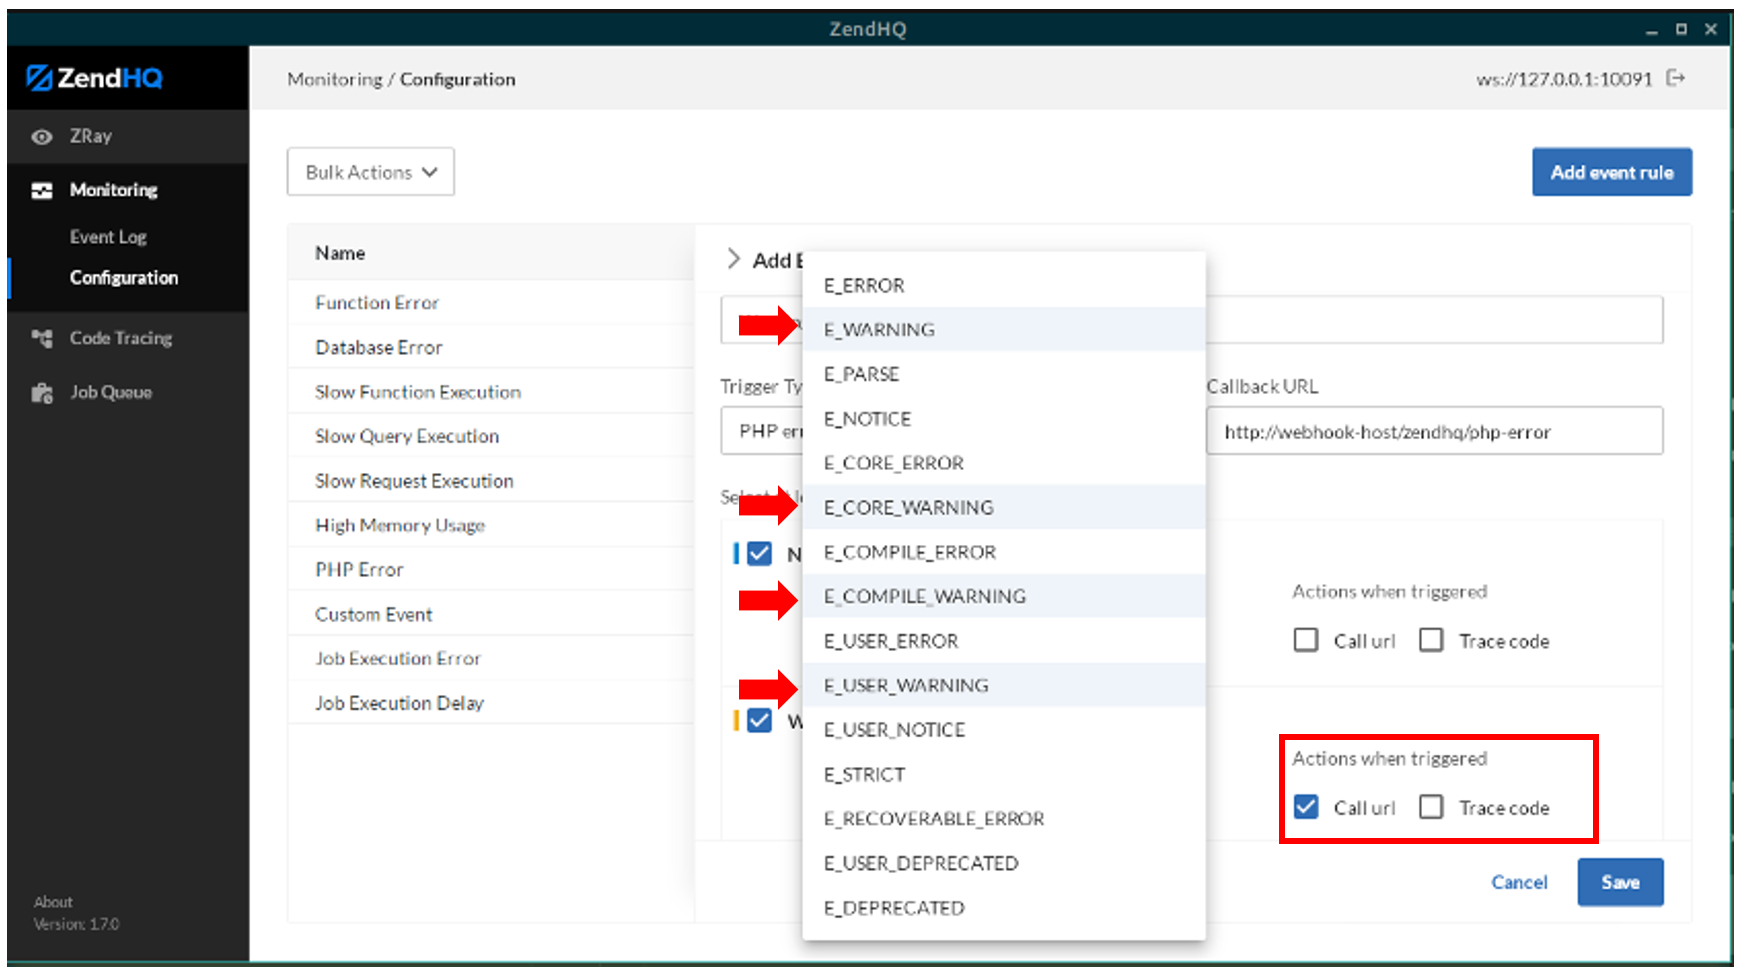
Finally, let's select a severity of "Critical," have it also call the webhook URL, and have it triggered by any error type:
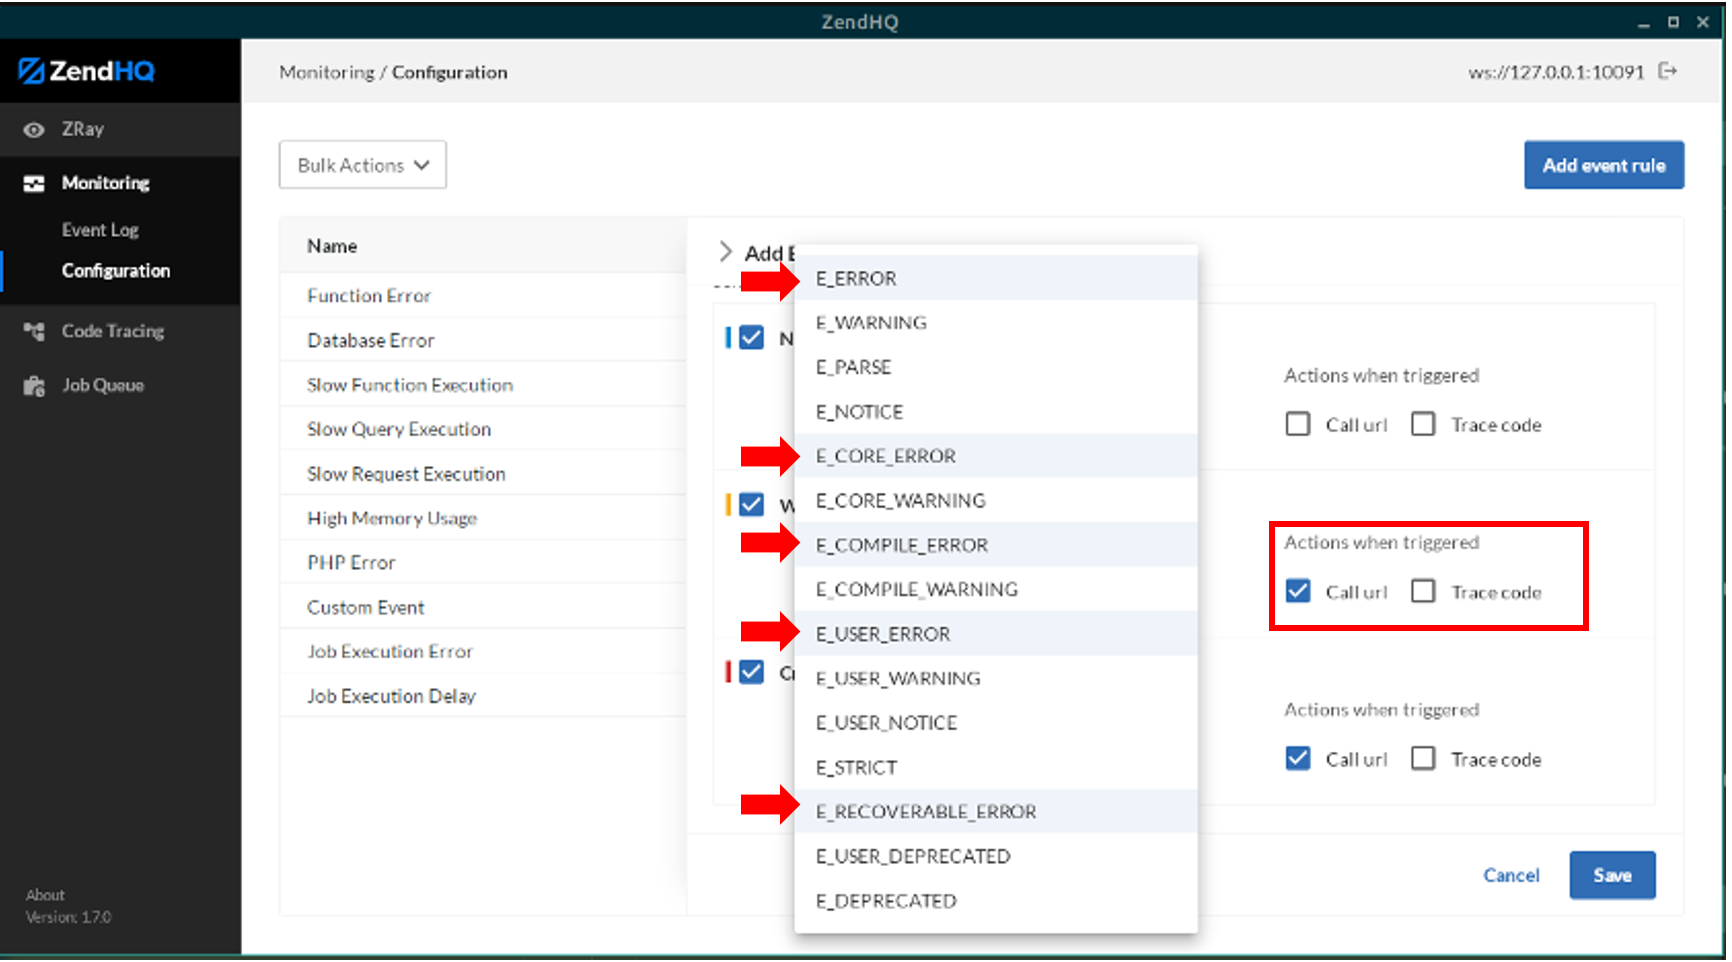
You can then save this new rule, and it will go into effect immediately!
Note: When you write your webhook, it will receive an event payload as a JSON object. You can introspect the "severity" property to differentiate between critical and warning events, allowing you to change how you handle the event — for instance, to send warnings to a Slack channel, and criticals to PagerDuty.
3. Start the ZendHQ OpenTelemetry Exporter
Now that we have some events, let's configure the ZendHQ OpenTelemetry exporter. This will allow us to see the overall number of events, which will let us know if we need to spend some maintenance effort to improve our application health. The exporter is a Python script, named zendhq_exporter.py, and it accepts the following arguments:
--url <ZendHQ_URL>
--user <ZendHQ_Username>
--token <ZendHQ_Token_or_Password>
--port <Port_to_expose_to_OpenTelemetry>
We'll set ours up to talk with our ZendHQ node on ws://zendhq:10091, and listening on port 9000:
zendhq_exporter.py \
  --url ws://zendhq:10091 \
  --user $ZENDHQ_USER \
  --token "$ZENDHQ_PASSWORD" \
  --port 9000
4. Configure OpenTelemetry to Scrape the ZendHQ Exporter
Next, we need to configure your OpenTelemetry collector to scrape the ZendHQ exporter, and send the metrics to your DataPrepper instance. The following is an example OpenTelemetry Collector YAML configuration file.
receivers:
  # Prometheus exporters
  prometheus:
    config:
      scrape_configs:
        - job_name: 'zendhq-exporter'
         static_configs:
           - targets: [ 'zendhq-exporter:9000' ]
         scrape_interval: 10s

exporters:
  otlp/metrics:
    endpoint: data-prepper-collector:21891
    tls:
      insecure: true

service:
  pipelines:
    metrics:
      receivers: [prometheus]
      processors: []
      exporters: [otel/metrics]
5. Configure DataPrepper to Export Metrics to OpenSearch
From here, we configure the DataPrepper instance to create a pipeline that accepts metrics and pushes them to a named index in OpenSearch. The following is an example metric pipeline configuration file.
metrics-pipeline:
  source:
    zendhq_metrics_source:
      ssl: false
      retry_info:
        min_delay: 1000ms # defaults to 100ms
        max_delay: 5s     # defaults to 2s
  processor:
    - zendhq_metrics:

  sink:
    - opensearch:
        hosts: [ "http://opensearch:9200" ]
        insecure: true
        index_type: custom
        index: "zendhq_metrics"
        bulk_size: 4
This accepts the incoming metrics, and passes them without any changes to OpenSearch, pushing them to a "zendhq_metrics" index.
6. Set Up an OpenSearch Dashboard Index Pattern
Within your OpenSearch Dashboards, you will now need to create an index pattern. Go to the "Management" heading, and click the "Dashboards Management" menu item:
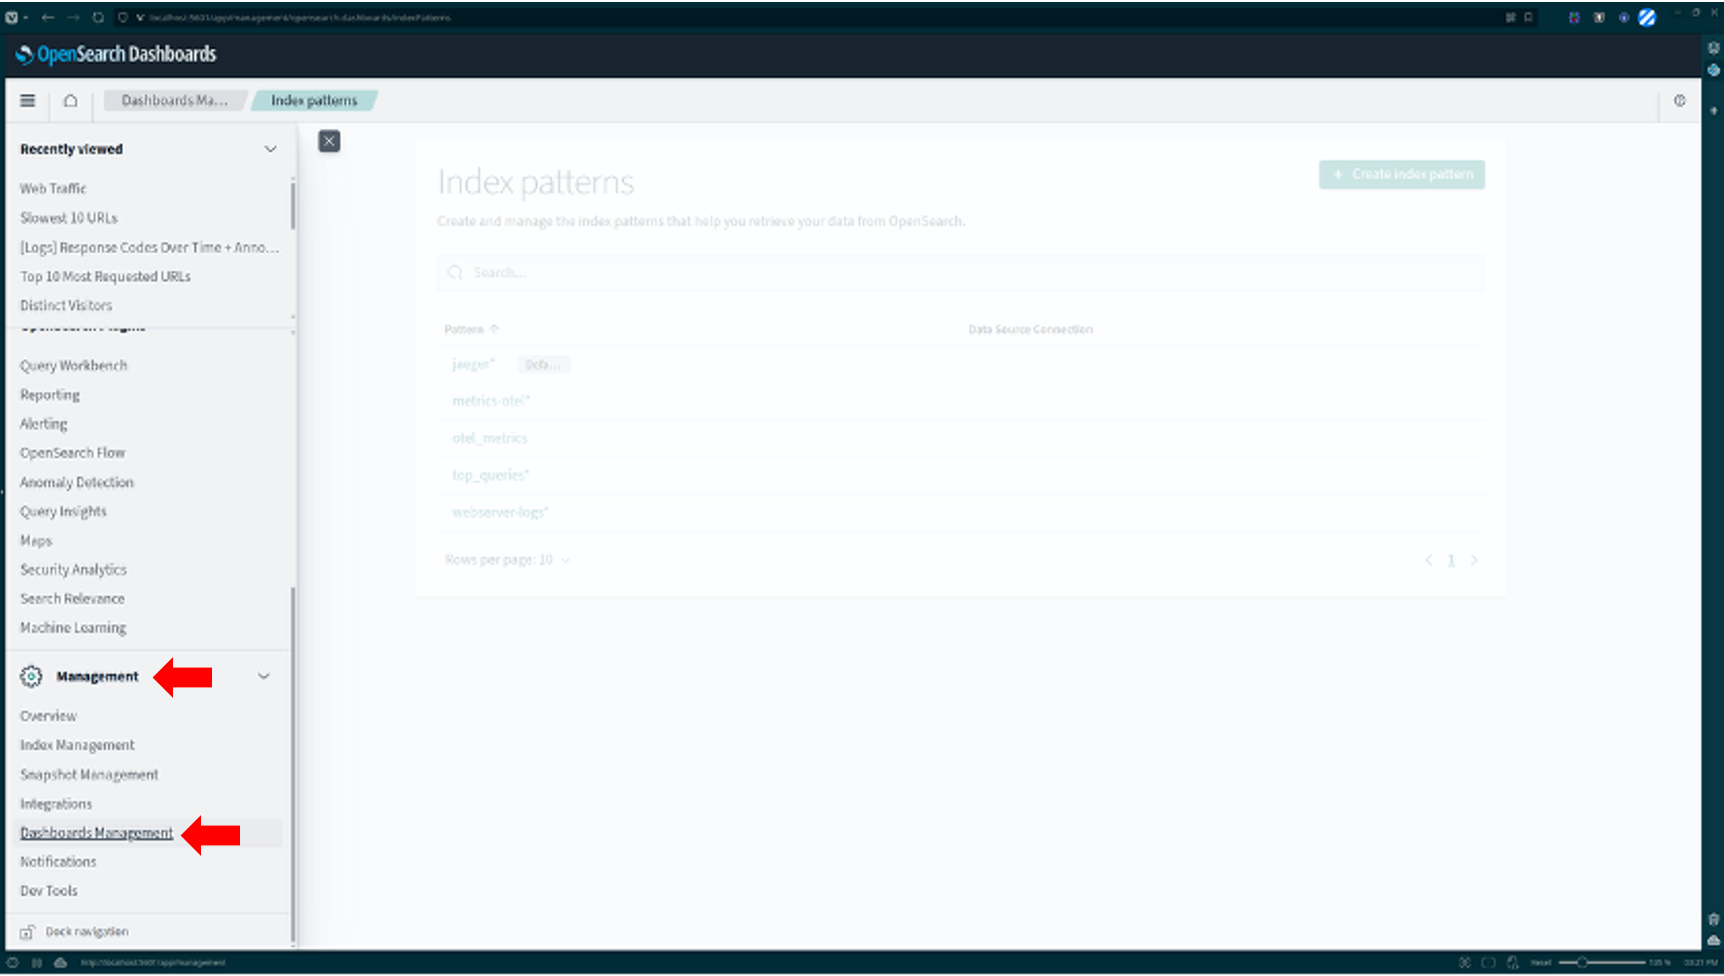
Choose the "Index Patterns" menu item, and then click the "+ Create Index Pattern" button.
For the index pattern name, type "zendhq_metrics" and then click the "Next step >" button. On the subsequent page, choose "@timestamp" as the Time field, and then select the "Create index pattern" button.
Now that you have defined an index pattern, you have a data source available for building out visualizations.
7. Building Visualizations for Your Dashboard
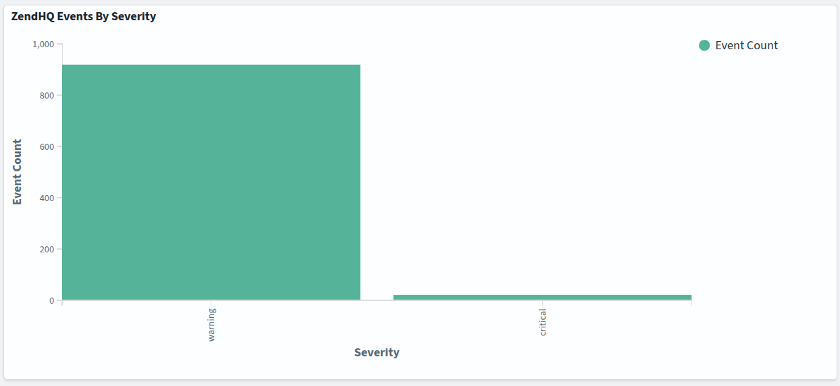
While beyond the scope of this post, you can now start building out dashboards with the metrics pushed by ZendHQ.
In particular, you'll look for a serviceName matching "zendhq-exporter" (or whatever the hostname is for your ZendHQ exporter), and a name field matching zendhq_events_emitted_total. From there, you can filter on the metric.attributes.severity field for one of "notice," "warning," or "critical" when building out your dashboards; the "value" of the most recent shows how many have been triggered.
Back to top
Final Thoughts
The combination of these tools gives your PHP DevOps team actionable insights via custom PHP alerts. They can get timely notifications for the issues that really matters, while having a passive dashboard for viewing overall health and helping identify problem areas. This ensures faster error detection, improved security, and a more focused workflow while providing deeper insights into application health and performance.
Still, integrating ZendHQ and OpenTelemetry for custom PHP alerts does require a certain amount of PHP knowledge and developer time. If your team is already stretched thin, your best option is to partner with a trusted third party such as Zend. Our global team is at your disposal and ready to help integrate ZendHQ into your existing infrastructure to help you make the most of your current tooling.
Mission-Critical PHP Made Possible
The Zend Enterprise Web Platform builds on ZendPHP + ZendHQ to deliver a single, customizable command center for secure, scalable, and observable PHP. Backed by best-in-class services, this all-in-one solution integrates OpenTelemetry metrics to extend your team's reach.
Additional Resources
- On-Demand Webinar - PHP Observability and Orchestration With ZendHQ
- Report - The PHP Landscape Report
- Guide - How to Develop Web Applications with PHP
- Blog - PHP Maintenance and Tech Debt
- Blog - PHP Web Application Hardening With CIS Hardened Docker Images
- Blog - Maintaining GDPR PHP Compliance
- Blog - Scaling PHP: Strategies and Approaches for Web Teams